Transports: Non-Confirmation for Stocks?The S&P 500 SP:SPX hit new all-time highs last week. But one noteworthy part of the market didn’t participate: transportation stocks.
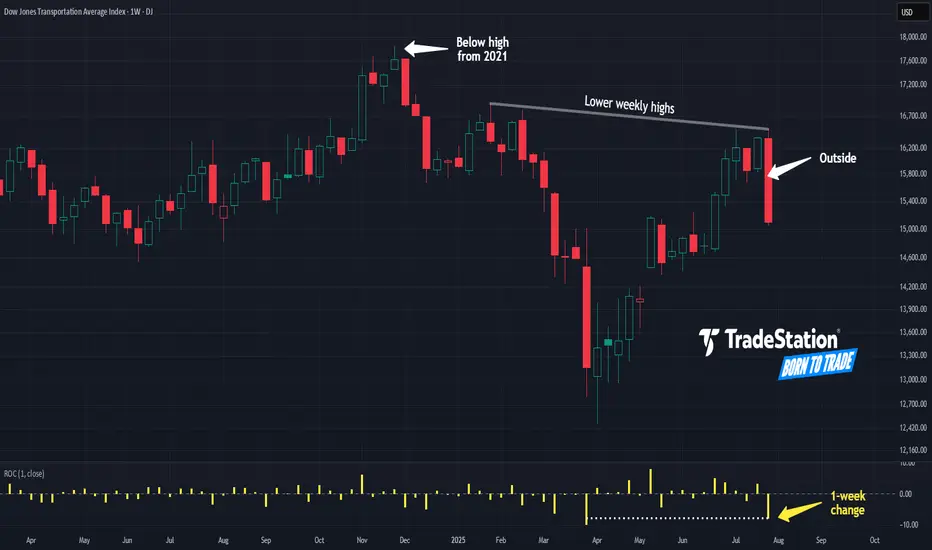
Today’s weekly chart of the Dow Jones Transportation Average shows how prices inched to a new high but failed to hold. They instead reversed and closed at the lowest level in over a month. The resulting bearish outside candle is a potential reversal pattern.
Second, DJT peaked last November below its previous all-time high from 2021. That’s a potential sign of poor relative strength.
Third is the series of lower weekly highs since late 2024. Why aren’t buyers driving the group to new records?
Fourth, rate of change in the lower study reveals the Transports lost 7.7 percent of their value last week. Aside from the extreme volatility around “Liberation Day,” it was the biggest weekly drop since September 2022.
Finally, there could be implications for the broader market because DJT is often seen as a bellwether for business and the economy in general. (This is often known as “Dow Theory.”) Given apparent weakening of the labor market last week, some investors may see a warning sign in DJT’s price action.
TradeStation has, for decades, advanced the trading industry, providing access to stocks, options and futures. If you're born to trade, we could be for you. See our Overview for more.
Past performance, whether actual or indicated by historical tests of strategies, is no guarantee of future performance or success. There is a possibility that you may sustain a loss equal to or greater than your entire investment regardless of which asset class you trade (equities, options or futures); therefore, you should not invest or risk money that you cannot afford to lose. Online trading is not suitable for all investors. View the document titled Characteristics and Risks of Standardized Options at www.TradeStation.com . Before trading any asset class, customers must read the relevant risk disclosure statements on www.TradeStation.com . System access and trade placement and execution may be delayed or fail due to market volatility and volume, quote delays, system and software errors, Internet traffic, outages and other factors.
Securities and futures trading is offered to self-directed customers by TradeStation Securities, Inc., a broker-dealer registered with the Securities and Exchange Commission and a futures commission merchant licensed with the Commodity Futures Trading Commission). TradeStation Securities is a member of the Financial Industry Regulatory Authority, the National Futures Association, and a number of exchanges.
TradeStation Securities, Inc. and TradeStation Technologies, Inc. are each wholly owned subsidiaries of TradeStation Group, Inc., both operating, and providing products and services, under the TradeStation brand and trademark. When applying for, or purchasing, accounts, subscriptions, products and services, it is important that you know which company you will be dealing with. Visit www.TradeStation.com for further important information explaining what this means.
DJT trade ideas
DJ Transports appear to be tracing out 5 wave moveAs a canary in the mineshaft to recessions the DJT appears to have topped in November 24 and the corrective 4th wave has or is near complete indicating a measured move down of 13% before a significant rally.
On the longer term view this may only be a C of a primary 4th wave Correction and will make new highs or could be the start of secular bear market,

DJT a trigger for stock markets?During Friday's session on WS, DJT closed near Fib. 0,382, a regular level for wave 4 termination.
During the last weeks, a "Contracting Triangle" and even a "Thrust" at 14140 apparently has been formed, which is slightly above the upper resistance-line of the trend-channel and not unusual.
This indicates, that the bullish sentiment of the last periods might be over.
Furthermore SPX and NDX, both closed well above Fib. 0,618, which often is a level for trend reversal.
DJI is also very close to this level. (It will be only a question of hours!)

DJT/SPX comparisonBearish case for equities.
Chart comparing DJT and SPX. DJT in wave ((c)) of regular flat, SPX in wave ((c)) of expanded flat.
SPX showing ending diagonal (wedge) to complete wave ((b)).
Bottom of SPX pitchfork (blue line) broke support and now acting as resistance.
This count anticipates each market to soon have a large (15-20%) 5-wave impulsive move down, DJT to complete wave 5 of (3) of ((c)) and SPX to complete wave (3) of ((c)).
After this proposed move, each market will have completed its wave (3) of ((c)).
I would expect wave (4) to be zigzag corrections for DJT and SPX before large wave (5)'s
to take price down towards March 2020 lows.

DJT transportation - Macro Bearish outlookI would count the 2022-2024 rally in DJT transportation index as a large corrective subwave (B) up to be followed by a subwave (C) of wave (4) down

Dow Jones Transportation Average Index morning technical analysiTechnical analysis of DJT (Dow Jones Transportation Average Index).
Watching this ticker as a leading indicator of a market downturn.
As SPX and NDX have made new ATHs this week, DJT is down 3.65%.
Blow-off top happened in November 2021.
It is hard to see price action since September 2022 as impulsive. Perhaps it will turn out impulsive after everything is all said and done; this count assumes it will not.
Bears looking for this to play out as a regular flat, with the C wave as a violent sell-off below 10k. Implies some black swan event, but such an event is not necessary.

DJT evening updateBear case for DJT.
Might history repeat itself?
Price action since October 2022 low certainly does not look impulsive.
If regular flat confirmed, looking for C below 10k.

DJT morning analysisTechnical analysis of DJT.
My current count has price in wave ((3)) of v, with bullish action likely for next few months/years.
Valid for price above 14547.90.

$DJT is almost ready to break above the LT bull flagLat week NASDAQ:DJT approached again to a long-term upside resistance bull flag line 15800 level. A break above this level will lead to a strong bull market continuation and this is also bullish for all the Indices and US stocks market as well.

A comparison of indicesThis analysis compares NDX, SPX, Dow Jones Transportation Index, and NYSE Index.
This analysis assumes that the indices are highly correlated and at similar points in their larger Elliott Wave structures.
This assessment views NDX, DJT, and NYA data as the primary wave 5 of SPX, whose data goes back into the 19th century.
NDX, had an extra impulse wave to complete, which allowed for the B wave in SPX.
It's hard not to see the five wave impulse in DJT, whose price has not gone above its 2021 high. It also makes me question whether SPX's bounce off October 2022 low has been corrective rather than impulse.
What I think gives this analysis some validity is the contracting ending diagonal wave 5 of NYA, which is the only way it can be labeled, given its position relative to the other indices, if indeed the other counts are correct.
Anything can happen, obviously, but I think the lesson from this possibility is for bulls to trend lightly.

Dow Jones Transportation Index Average, Big PictureMy current count has a leading diagonal (A) or (1) from 18246.51 to 11946.21, corrective wave (B) or (2) up to 16717.04, wave 1 of (C) or (3) down to 13471.47, and wave 2 of (C) or (3) up to 16273.
I'm looking for DJT to roll over and go after the median line of the pitchfork. If this were to happen, I would assume equities are at or near the top.

Distribution on DJTSeeing distribution on Dow Jones Transportation index on monthly chart.
Dow Jones Transportation Index is going down.

An Overbought RSI Can Stay OverboughtAs seen, the DJT stayed overbought for a long time, in a "stepping stone" kind of move. On the other hand, if FDX knocks this down enough today, it could be a good sell-signal for other indexes.

Impact Analysis: Major Events and Their InfluenceI've conducted extensive research on various impactful events such as interest rate cuts, hikes, U.S. elections, major recessions, pandemics, and more, compiling the data into a comprehensive chart. While additional information like major conflicts and wars could be included, the chart already provides a clear representation of how these events have influenced market trends.

DJT - transports are not looking goodDJ:DJT Transports are getting killed. August was a significant change in trend. A test of the light blue area is possible and could like up with early Nov with mid Dec as possible rebound if the time zones remain relevant.

Dow Jones Transporatation and S&P 500, risk-on alertDow Jones Transporatation and S&P 500, risk-on alert,
watch closely 14100 and 4180 for potential start of bleeding.


Dow Jones Transport tends to predict inflationThe yellow line is inflation and the candles show the Dow Jones Transport index which represents the fortunes and costs of transportation companies. Transport is a major cost to getting products to market and so if DJT is going up it often then is reflected in the official inflation rate after a lag.
Right now DJT is in a downtrend since the middle of this year. Unless it bounces from here and starts to make higher highs the DJT as a predictor of inflation suggests that inflation is contained. As I showed in my RINF chart, this isn't what is anticipated by the market.

DOW TRANSPORTATION .50 % and 618% The wave structure can be counted as a wave 4 drop this would setup the last wave up from today as the setup for support is been seen today . and put call models are set and oil is setup to break from 93/95.5 back to under 84 /79 this would be supportive for the djt

Dow Jones Industrial Average Key MomentMACRO MONDAY
Dow Transportation Average Index DJ:DJT
The Dow Jones Transportation Average (DJT) is a price-weighted average of 20 key transportation stocks traded in the United States.
The transportation sector acts as a leading indicator as it is further up the value chain ahead of the final products being sold by companies in Dow Jones Industrial Average $DJI. For this reason, in some circumstances we can use the DJT as a helpful leading indicator for the direction of the economy
Currently we are at a critical juncture on the DJT chart as we are testing significant resistance levels
- The DTJ Index is at a critical diagonal and horizontal
resistance level
- A break through or rejection of the resistance will
provide insight into the direction of the economy
- There is a potential Head and Shoulders pattern
that needs to be validated or invalidated which will
be defined by the price reaction to the resistance
zone.
We can observe what happens over the coming weeks and how price reacts to the resistance. Can it break above it and turn it into support?
When the DJI is climbing higher while the DJT is falling, it can be a signal of economic weakness ahead. A divergence of this sort means goods are not being transported at the same rate they are being produced, suggesting a decline in nationwide demand.
This type of divergence occurred prior to the March 2020 crash with the DJT making its ATH in Dec 2020, thereafter the DJI made a new ATH in February 2020 whilst the DJT was closing almost 5% lower making a lower high. Those that study Dow Theory were key observers of the divergence and acted accordingly safeguarding their portfolios.
Thankfully, at present there is no divergence. I will follow up in the comments with a chart showing that the DJI and the DJT are currently very closely aligned. Regardless paying close attention for a divergence could be very beneficial for your portfolio. I will certainly be on the look out and notify you in the event of.
Thanks for reading and welcome to Macro Mondays
PUKA

Might not want to go long when things are this overbought In this video I've shown how extended the Dow Industrials as well as Dow Transports are. This type of overbought setup has consistently marked tops in the past so I am currently bearish and waiting for a correction to play out over the next 4 weeks.
I am expecting an approx. 10% drop in the markets before going long


POSSIBLE HEAD & SHOULDERSPrice is well above the neckline.
ES would be a break of the neckline which strong support until broken.
Price is at a resistance level today.
This pattern is not valid until the neckling is broken with a confirmed downtrend.
No recommendation.
