Watch Dow Utility Trend LinesA break of the DJU trendlines could determine its course for the next several weeks.
A break above the DJU declining trendline from the December 2022 peak could open the door for a rally to 1,000.
A break below the DJU rising trendline from its October 2023 bottom could trigger a move back down t
Related indices


Completing A flag!....looks like a Sound Signal to long DJUA! Chat tell us to buy DJUA & is a good signal for shorting Dollar Index!


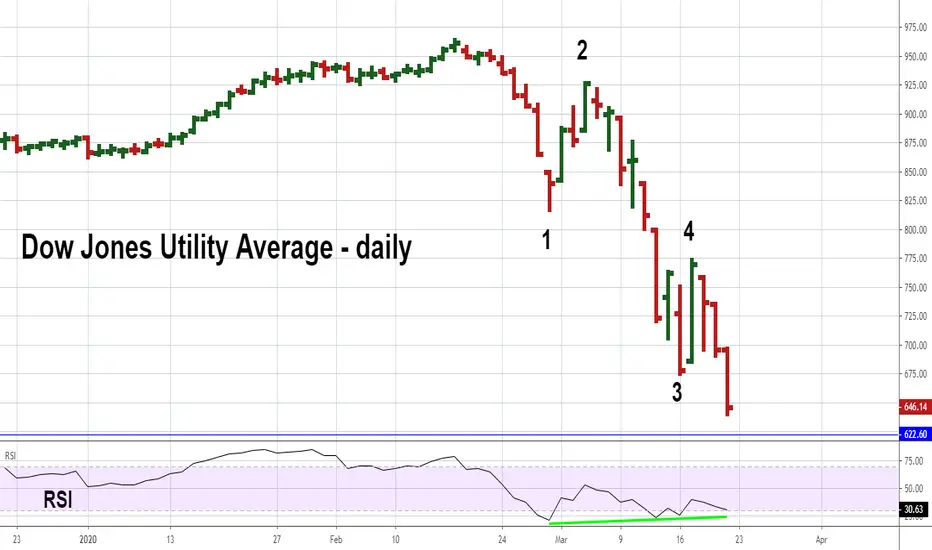
Dow Utilities Could Find Crash Bottom - Part TwoWithin an Elliott five wave impulse pattern, wave "one" is usually equal to wave "five".
On the daily Utility chart wave "1" = 145.83 points.
The wave "4" high is 773.49 - 145.83 = 627.66 as target for wave "5" bottom.
The DJU rally from March 2009 to February 2020 was 675.14 points x .50 = 337.57

Dow Utilities Could Find Crash Bottom - Part OneThe Dow Jones Utility Average could be the most important US stock index to watch during the week of March 23 to March 27.
This index has the clearest Elliott wave count, showing its probably in the fifth wave down from the all-time high.
There's fascinating short and long term Fibonacci relationsh

Industrials consumption of the staples defensives sector...Industrials consumption of the staples defensives sector... proportion not yet the same as the two previous cycles dot com and subprime bubbles....

DJU Utilities Short OpportuintyDow utilities index ended the week at 711.
If it breaks above 713 - 38.2 Fib Retracement-, it is likely to test Fib 61.8.
We plan to short DJU at Fib 61.8 - 732.02 -
Note: Bearish Swan at 729-732


See all ideas
Summarizing what the indicators are suggesting.
Oscillators
Neutral
SellBuy
Strong sellStrong buy
Strong sellSellNeutralBuyStrong buy
Oscillators
Neutral
SellBuy
Strong sellStrong buy
Strong sellSellNeutralBuyStrong buy
Summary
Neutral
SellBuy
Strong sellStrong buy
Strong sellSellNeutralBuyStrong buy
Summary
Neutral
SellBuy
Strong sellStrong buy
Strong sellSellNeutralBuyStrong buy
Summary
Neutral
SellBuy
Strong sellStrong buy
Strong sellSellNeutralBuyStrong buy
Moving Averages
Neutral
SellBuy
Strong sellStrong buy
Strong sellSellNeutralBuyStrong buy
Moving Averages
Neutral
SellBuy
Strong sellStrong buy
Strong sellSellNeutralBuyStrong buy
Displays a symbol's price movements over previous years to identify recurring trends.