REIT trade ideas
REIT 3d ChartDJ:REIT Looking like it's forming a head and shoulders. With the added interest rates hike shocks, it's only a matter of time until REITs get hit, most importantly commercial real estate. The chart does not paint a pretty picture, but considering the way this market has been behaving, I wouldn't be surprised if we see some crazy shit happen, before reality catches up.
Regardless, the chart doesn't look too pretty.
Real Estate Sector; A Very Bearish FractalJust like in the lead up to the 2008 the REITs have been going up with no sign of slowingh down whilst inside of an Ascending Broadenign Wedge/Channel and has on it's 4th attempt gone above the Supply Line Breifly only to very quickly come back down again and now it's cracked below botht the 21 and 55 Month EMAs; The last time it's done marked the beginning of an accelerated move down and the eventual Breakdown of the wedge where it then went for the measured move of the wedge which is the price where the wedge began; In this case that would be back down at $289.91
For more context as to how this dump started check the Idea in the Related Ideas Tab as that has a Weekly Timeframed Chart of the VNQ ETF that was showing Bearish Variables before the REIT's Decline Began.
The Housing Crash of 2022Hello friends. The housing market hasn't crashed *yet*, but it's about to! It's interesting to see that we had a bubble pop in Crypto, NFTS, Growth Stocks, Tech Stocks, and many other asset classes within the past couple years. The main theory is that all the new money created by the FED has allowed for prices to rise dramatically which leads to speculation which leads to even higher prices. The cycle goes on until reality sets in and the bubble bursts. Today I am here to tell you that the Music Has Stopped Playing; The bubble has burst.
The US dollar bubble is over. The US stock market bubble is over. The US real estate bubble is over. Do you see the trend yet?! The world in 10 years will look very very different from the world today. The US will likely not be the world leader anymore.
You may wonder, ""Why In The World Would The Housing Bubble Ever Pop???"", or you may even think ""We aRe NoT In A BuBBlE1!111!1"". Perhaps you think that "HouSinG will AlWayS Go Up1!!1111!". Whichever of these moon boys you cosplay as, you are easily proven wrong. House prices went along with other commodity prices as they rose dramatically due in large part to ungodly amounts of speculation. Based on Elliott Wave analysis combined with fundamental analysis, commodity prices have nearly peaked, and housing prices have *already* peaked.
What happens to the bubble riders when to their chagrin:
Interest rates rise, making it harder for bubble boys to leverage to the tits and buy real estate that they could never in 1000 years afford with their own money
Capital becomes more expensive due to deletion of wealth, forcing the Landlords to lower their rent prices or else face difficulty in finding a tenent
Inflation falls dramatically -- Kalshi predicts that the most likely 2022 annual CPI inflation for the US will be 5.0-5.9%, which is a rapid drop from the current year over year inflation of 8.3%. (I personally expect annual CPI to be even lower)
The economy enters a recession (halfway there already!) -- The odds of a recession by 2022 Q2 are 95% according to Kalshi!!
Housing production starts to ramp up, and supply once again increases
So now Hoomer, you can either choose to sell your home now, for a wild price, or you can wait and sell it to me for a bargain later. Some wise Hoomers may also decide to hedge their homes by shorting house ETFs. I myself will be loading up on some puts on these "REIT" ETFS, to hold for the long term.
REIT putsUS real estate is dramatically overvalued and formed a bubble due to supply constraints. Now that the bubble is popping, the prices can tank down like a rock. I will buy some puts if we can see this pullback play out. Otherwise I will wait patiently for another chance. I'm not long here, just a wolf waiting to feast.
Bursa Reit Index - Recover from bottomBursa REIT Index - Recover from bottom & worst may already over
Shortlist REIT counters
1) IGBREIT
2) Sentral
3) UOAREIT
Note: For Interested to subscribe the VT MCDX Smart Money Plus and learn Victor Trade System, and kindly contact owner
(Disclaimer: for demonstrate own planned trade records study only and education purpose, not for recommend to buy or sell. Trade at your own risk
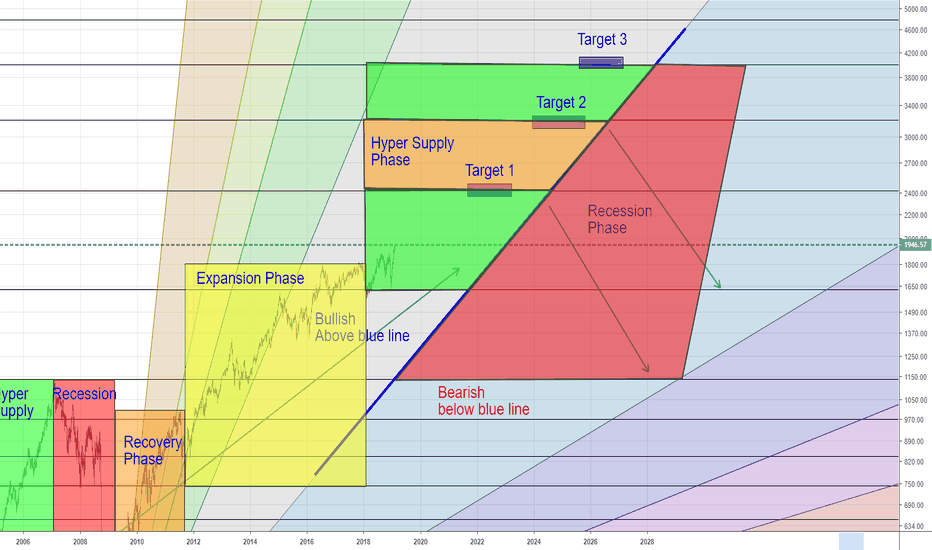
Real Estate Market CycleThe "Real Estate Market Cycle" is made up of four distinct phases.
Recovery
Expansion
Hyper Supply
Recession
There isn't an exact length of period of time each phase must last, but taken as a whole, the entire cycle averages 17 to 18 years from peak to peak.
Looking at the previous cycle (1989-2007) we can use Fibonacci and geometry to see where we currently are in the cycle and predict where we are going.
Currently, it appears that we are in the relatively early stages of hyper supply. This phase began with the passage of the Trump tax cuts and fuel was thrown on the fire with the capitulation of the Fed following the Christmas '18 blood bath in stocks.
The hyper supply phase can be lengthy but can also be short.
Absolute worst case, we have a year left in the hyper supply phase.
But more likely is we have 3+ years remaining. Somewhere between 3 and 7 years from now.
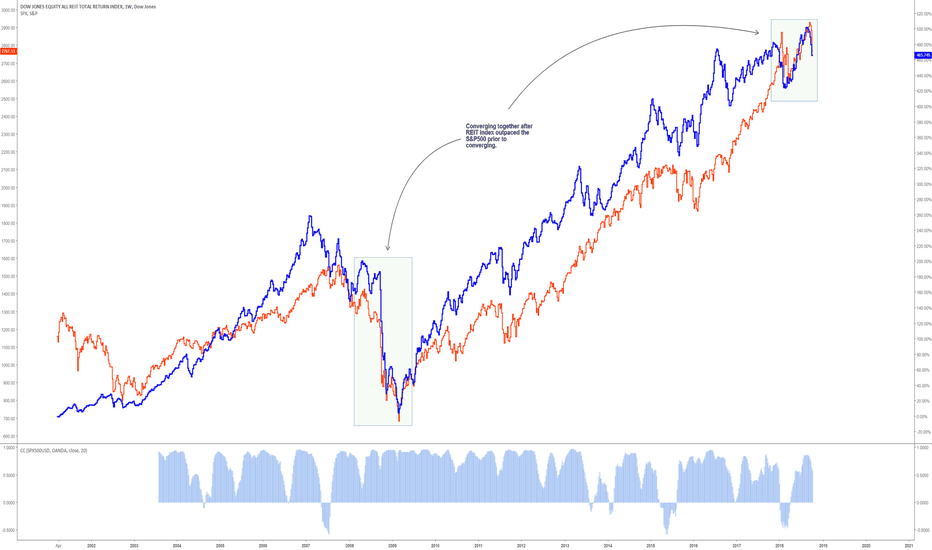
REI REIT index is identical to 2008, impending drop comingIf you take a look at the behaviour of the REI index before, during, and after the 2008 recession and present day. The REIT is in blue, the S&P500 is in red.
Before
REI index is outpacing the S&P500
During
REI index is converging with the S&P500
the indices both fell together with the REI falling more aggressively
After
REI index recovers quicker and begins to outpace the S&P500 again
We are in the during phase.


