USDOLLAR trade ideas


Sacred geometrylast night what I did with the tools on the tradingview chart... Inspiration!🙏☺️
Sacred geometry
"The wisest and noblest teacher is nature itself."
~ Leonardo da Vinci
Learn more about Sacred Geometry and how it is relevant to better understanding our world and our part in it.
Open your eyes

SPX or the traditional market pretty much follow USDollar index correlation anyone. the markets traditional esp follow inversely the USDollar index or if USD goes down Stock market goes up and vice versa

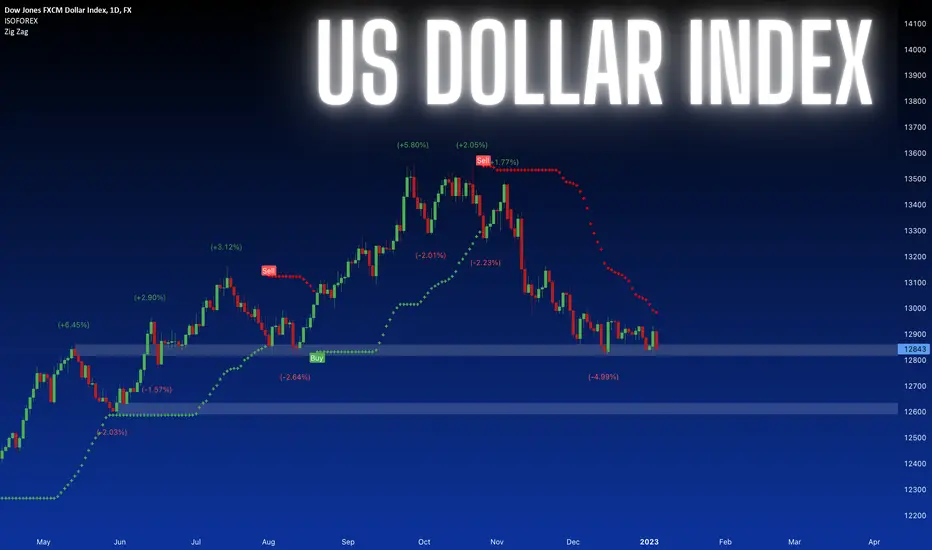
USDOLLAR OutlookBirds Eye, Highlighted box, sell off to 12600. This fails, 13000 could be booked then sell off.
Looking for that EU trade to play out next week. Temporary strength overall weakness.

Dollar great breakout of falling wedge
The dollar breaks out hard from a falling wedge which is very bullish. Target just for the falling wedge is around BigRed where will dollar meet with a big resistance level. Chances to go there or even higher are great, especially after such strong Nonfarm payrolls and unemployment which indicate FED will have to continue with interest rate. With dollar 1, 2, and 10 Years yield also moving up strongly indicating they support the dollar.
RSI moved out from bullish divergences and now is in a neutral area.
MACD similar to RSI, after activation of bullish divergences now is neutral.
Overall: it was obvious as we wrote in the last analysis (morning daily report) dollar will move up strong as the falling wedge is one of the strongest bullish patterns. Now the first initial target is BigRed where the price will find some resistance, cool down and likely continue to move up. For bulls, the best option would be retesting BigRed, getting rejected, consolidating on the level below BigRed, and then during the march FED meeting breaking out hard. Otherwise, this will only be a bear pullback with a price further drop.

Dollar in troubleThe USD Dollar index monthly continues to drop while the market is surging higher. After an extreme rise in the last two years, Dollar corrects from highs.
January did drop below the trend line which is bearish. At the moment it is on several levels of support which will be hard to break on the first try, therefore, it didn't get a sell signal. There is support from April 2022 highs, close to 0.5Fib retracement from low to high, and here is 20 month MA which will very likely act as support.
RSI did cool down and now is neutral. MACD histogram is close to ticking red while the MACD line is falling below the signal line which is bearish for Dollar.
It is likely dollar will bounce from this level but it is a big question will it only be bounced or a new rise? It is a big question of what the FED what to see, a weak or strong dollar as a weak dollar has big inflationary pressure.

The dollar index is still going downThe dollar index is still going down. Hence, the AUDUSD, GBPUSD, EURUSD, etc. Will keep going down. Avoid all sells.

USDollarUSDollar has formed Head And Shoulders and im waiting for a retest than it will go short.
Remember when USDollar go long XAU,EUR,GBP,...etc..the all go short.
This is MY strategy,always follow yours.
Thank me Later

20230109: USDOLLAR Long Term TrendFX:USDOLLAR
Monthly Chart:
Weekly Chart:
Daily Chart:
USDOLLAR price action has been dropping since Q4 2022.
It has reached the first support zone on monthly chart.
I am waiting for the price to consolidate further and determine the direction.

DXY - Short OpportunityThe long trend line is breaking. Waiting for price to pull back and if price hold, short with tp & sl indicated

DOW - NFP + Monthly low = ? FX:USDOLLAR
Totally uneducated assumption but with the pandemic and recession I'd assume NFP will come back negative but who knows maybe that would encourage/force people to work to pay for increased living expenses due to inflation and rate hikes. Also the fact that people working multiple jobs for sperate companies count as a point for each job they work. 10x people working 3x jobs count for 30x people in the workforce. So not really much of an indicator of productivity but you never know...
Either way, DOW (USD) is at a monthly low (support) and has bottomed out indicating new support.
Price has broken the first resistance level and retested a support on Zone #1 (red)
If NFP is positive, it should break the current resistance Zone #2 (yellow) and run up to Zone #3 (orange) +
Possibly even higher, could be big volume due to the significance of this zone on the weekly.
If it's negative i'd say we'll be retesting that weekly low again (Zone #0 Green)
(*NOTE: This move will also indicate/influence the direction of the EUR/USD pair, as it is at a historical low)

DOW Jones about to pop!Retraced back to mean and is consolidating, waiting for breakout above consolidation range for entry. Could form a second peak and form a H&S especially if recession hits through 2023.
Buy the break above 12,950.
TP1: 13,000
TP2: 13,090
TP3: 13,160
If price breaks below 12,799, short.
TP1: 12,750
TP2: 12,700
TP3: 12,650

What Will 2023 Be Like For Major Economies? Market AnalysisKey events:
USA – ISM Manufacturing PMI (Dec)
USA – JOLTs Job Openings (Nov)
USA – FOMC Meeting Minutes
The classic year-end reviews here and there reminded us of the exceptional nature of the past year: the Russian aggression in Ukraine, the energy and food price shock, serious problems in the labor market, inflation that exceeded the central banks' target rates several times, which led to a tightening of monetary policy on the "whatever it takes" principle, etc.
US core inflation rate
Last year was a year of fundamental changes and a shift in geopolitical and economic benchmarks. Looking ahead, we can say that 2023 will see a change in the direction of key economic variables. Core inflation should fall significantly, central bank rates should reach their cyclical peak, and the U.S. and eurozone will spend part of the year in recession. 2023 can be considered a transitional year, paving the way for further disinflation, a gradual decline in rates, and a soft recovery in 2024.
Finally, the U.S. and the eurozone should spend part of the year in recession. This can be seen as the price to be paid to bring inflation back under control with tight monetary policy. Recessions are disinflationary because low demand reduces the price power of companies and slows wage growth.
US federal funds rate
This means that 2023 can be seen as a transition year, paving the way for gradual normalization in 2024. Normalization means a significant narrowing of the gap between observed and target inflation, allowing central banks to begin cutting interest rates, probably in the first half of 2024. This outlook should support investor appetite for risk and increase household and firm confidence, thereby contributing to the economic recovery.
While these general trends look very likely, the devil is in the details. The transition period in 2023 may be bumpier than expected. The baseline scenario calls for a short and shallow recession thanks to a few resilience factors, but the downturn could be more severe than expected.
Possible causes could be a new, significant, and prolonged increase in gas prices or a slower-than-expected decline in inflation, which could raise fears of rising interest rates and thereby hit demand. Rising rates in the past may also have a greater impact than expected, especially on the housing market and credit conditions.
Another question concerns normalization in 2024: What will it look like? This question is important because expectations about the nature of the economic recovery will influence the decisions of firms and households this year. The list of drivers of the recovery is long, but there is nonetheless reason to expect that the recovery will be mild, for at least two reasons. Traditionally, central banks aggressively cut interest rates when the economy enters a recession, but inflation will still be too high in this cycle. The rate cuts should come later and be more gradual than usual because of the slow decline in core inflation. This means less stimulus for final demand. Another factor is labor shortages. Companies are having trouble filling vacancies, which will likely make them reluctant to lay off staff during a recession. However, this also means slow job growth during the recovery.
DXY - Long OpportunityWatch out for a break of the wedge. Conservative trade can long with sl indicated.
MACD divergence also reflected indicating long position.

Potential Short Entry in After News TradingFor the last 4 days, the daily candle ranges didn't exceed 5 Average Daily Range. In the last 240 days, the largest volatility-decreasing sequence lasted 7 days and isn't at all common. I think it is quite likely, that we will see an above 100% expansion now.
If it goes higher during the news, I would fade this event and hold the trade at least until today's close (as EURUSD and GBPUSD or another major pair).
I don't have any plan for USD going lower during news and will not trade such an event.

Hourly Daytrade - Needs To Materialize Before 16:00 (GMT+0)The price created nice Fair Value Gap (purple area) with some sort of orderblock above. It would be nice to take a raid from that area down before the end of NY killzone.

USDOLLAR ForecastAt the current candle, the dollar appears neutral. In an impulsive wave, the trend retraces at 0.618, but three more bullish candles are needed to confirm a change in the market or a clear higher low. Right now, there isn't any.
Some attention is required for 12664, and if the price falls below 0.786, the forecast will be invalid. The price could potentially rise to two marked pivot levels.

USDOLLAR - Triangle Leading to ContinuationRed dashed line showing a resistance that has recently turned into a support with a strong move upwards
Strong green line showing a strong uptrend
These come together nicely forming a triangle
I expect this to lead to further bullish continuation along the green line as price progresses, as suggested by the green bars pattern

USDOLLAR Long Setup!USDOLLAR is retracing back into a weekly Order Block, from this zone we can expect a reaction and a push to at least 13250$.

USDthe line maybe is important line zone for buy or sell.
note : my analysis and trading style is base on supply and demand , support and resistance . market structure, and price action.
before entry I will wait and see how price approach and react to the zone. must waiting / look how price action (reaction) and market pattern when price come to the line zone before decide to entry at the line zone.
if didn't have any good price action and market pattern. I will ignore the zone.
"trade what u see on the chart and think (by logic) , do not trade with what u want or what u asked or what u hope (by emotional)"
happy trading all

USDOLLAR - Extra Bullish ScenarioSimilar Up Channels can be drawn, with the period in the middle being a period of low / no growth
Early growth can be used as an indicator of future growth?
The horizontal white line is a baseline, very strong support

USDollar OutlookThe US Dollar Index has been in a sustained upward trend on the daily timeframe. However, lower timeframes on the 1H has broken structures to the downside starting a new downtrend (even though DLY is still bullish).
Looking for price to sweep liquidity resting above 13350 - 13360 to take shorts only to13260 - 13250 zone
