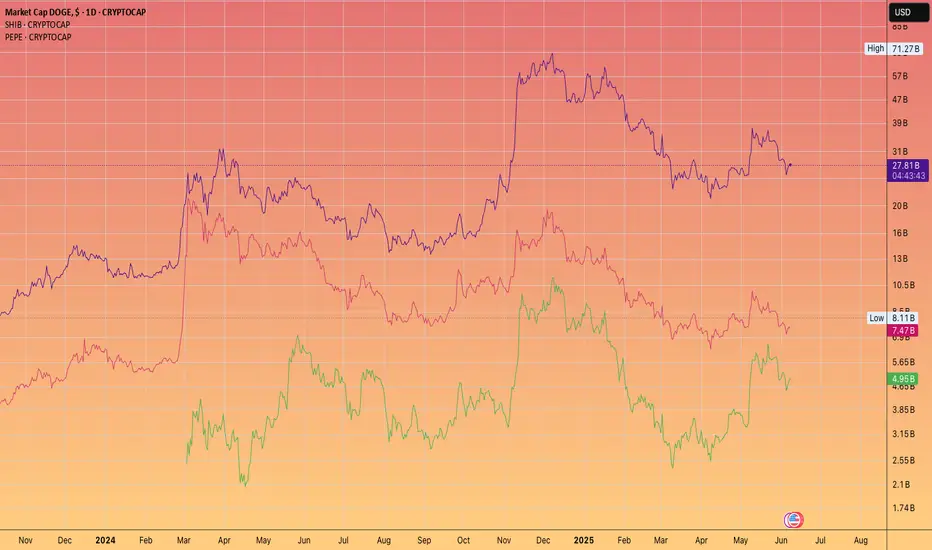
[$DOGE] Memecoins on the rise - but what about [$MREO]
DOGE CRYPTOCAP:DOGE
NASDAQ:MREO
No financial advice.
For Entertainment purpose only.
Instead of chasing the crypto cycle - why not 'bet' on other assets with a realistic chance?
here is a potential alternative 60 day trade...
it is basically
CHAPTER 11 vs EPIC COMEBACK.
DOGE trade ideas

[$DOGE] Memecoins on the rise - but what about [$MREO]CRYPTOCAP:DOGE CRYPTOCAP:DOGE
NASDAQ:MREO
No financial advice.
For Entertainment purpose only.
Instead of chasing the crypto cycle - why not 'bet' on other assets with a realistic chance?
here is a potential alternative 60 day trade...
it is basically
CHAPTER 11 vs EPIC COMEBACK.

Pepe is going flip SHIB. But can it catch Dogecoin?If Ethereum were to smash $10k
Then it has a genuine chance IMHO
We shall be watching and tracking this as the cycle reaches it's mania phase!
DOGE|Bearish Triangle Formation On30-Min Chart-Breakdown Ahead?📉 DOGE Bearish Triangle Breakdown | 30-Min Chart
This chart highlights a classic *bearish triangle formation* in DOGE's market cap on the 30-minute timeframe. The pattern shows a series of lower highs with horizontal support around the 32.45B zone.
🔍 Key Observations:
- Pattern: Bearish Triangle
- Resistance: ~34.7B
- Support Zone: ~32.45B
- Target Zone (Post-Breakdown): ~31.3B
A breakdown below the support level could signal further downside movement. However, confirmation is key — traders should watch for volume and candle close below support.
🕒 Timeframe: 30-Minute Chart
📆 Analysis Date: May 29, 2025
---
⚠ *Disclaimer:*
This analysis is shared purely for *educational purposes* and does not constitute financial advice. Please do your own research and risk management before making any trading decisions.

Doge top signalHTF doge always blasts off top, somewhat crossing BTC's price delta when there's a macro top. might be a good added signal to look at for timing the market tops.


dogecoin bullish biasi anticipate that dogecoin will continue dropping down to the key surport zones that i have highlighted on the chart, before it gains the bullish momentum within those key zones highlited.

DOGE Market Cap – 30-Min Long Trade Setup !📌🚀📈
🔹 Asset: DOGE Market Cap ($)
🔹 Timeframe: 30-Min Chart
🔹 Setup Type: Bullish Breakout Trade
📌 Trade Plan (Long Position)
✅ Entry Zone: Above 29.29B (Breakout Confirmation)
✅ Stop-Loss (SL): Below 28.52B (Invalidation Level)
🎯 Take Profit Targets:
📌 TP1: 30.38B (First Resistance Level)
📌 TP2: 31.47B (Extended Bullish Move)
📊 Risk-Reward Ratio Calculation
📉 Risk (SL Distance): 29.29B - 28.52B = 0.77B risk per unit
📈 Reward to TP1: 30.38B - 29.29B = 1.09B (1:1.41 R/R)
📈 Reward to TP2: 31.47B - 29.29B = 2.18B (1:2.83 R/R)
🔍 Technical Analysis & Strategy
📌 Bullish Falling Wedge Breakout: Price breaking out from a bullish wedge, signaling upside.
📌 Support Confirmation: Strong support at 28.52B, acting as a demand zone.
📌 Volume Confirmation Needed: Ensure rising buy volume above 29.29B for confirmation.
📌 Momentum Shift Expected: Holding above 29.29B could push price to 30.38B and further to 31.47B.
📊 Key Resistance & Support Levels
🟢 31.47B – Final Target / TP2
🔴 30.38B – First Resistance / TP1
🟡 29.29B – Breakout Level / Long Entry
⚪ 28.52B – Stop-Loss / Support Level
📉 Trade Execution & Risk Management
📊 Volume Confirmation: Look for strong bullish volume above 29.29B before entering.
📉 Trailing Stop Strategy: Move SL to entry (29.29B) after TP1 (30.38B) is hit.
💰 Partial Profit Booking Strategy:
✔ Take 50% profits at 30.38B, let the rest run toward 31.47B.
✔ Adjust Stop-Loss to Break-even (29.29B) after TP1 is hit.
⚠️ Fake Breakout Risk
❌ If price drops below 29.29B after breakout, exit early to limit losses.
❌ Wait for strong bullish candle close before entering aggressively.
🚀 Final Thoughts
✔ Bullish Setup – Falling wedge breakout signals potential upside.
✔ Momentum Shift Possible – Watch for volume confirmation.
✔ Risk-Reward Ratio – Favorable 1:2.83 R/R to TP2.
💡 Stick to the plan, manage risk, and trade smart! 📈🔥
🔗 Hashtags for Reach & Engagement:
#Dogecoin 🚀 #DOGE 📈 #CryptoTrading 📊 #TradingNews 📰 #MarketUpdate 🔥 #Investing 💰 #LongTrade 🏆 #Crypto 📉 #ProfittoPath 🏆 #SwingTrading 🔄 #DayTrading ⚡ #TechnicalAnalysis 📉 #CryptoSignals 📊 #FinancialFreedom 💡 #MarketTrends 📊 #CryptoAlerts 🔔 #TradeSmart 🤓 #Bullish 📈 #RiskManagement ⚠️ #TradingCommunity 🤝 #SmartTrading 💰 #MarketAnalysis 📊 #TrendBreakout 🚀

DOGE/USD – 30-Min Long Trade Setup!📈 🚀
🔹 Asset: Dogecoin (DOGE/USD)
🔹 Timeframe: 30-Min Chart
🔹 Setup Type: Bullish Reversal
📌 Trade Plan (Long Position)
✅ Entry: Above $27.85B (Breakout Confirmation)
✅ Stop-Loss: Below $27.29B (Break of Support)
🎯 Targets:
📌 TP1: $28.86B (First Resistance Level)
📌 TP2: $29.84B (Extended Bullish Move)
📊 Risk-Reward Ratio
📈 Risk: $27.85B - $27.29B = $0.56B
📈 Reward:
✔ TP1: 1:1.8 R/R
✔ TP2: 1:3.5 R/R
🔍 Technical Analysis
📌 Falling Wedge Breakout – Bullish structure forming.
📌 Reversal Signal – DOGE reclaiming support & pushing higher.
📌 Breakout Confirmation – Strong candle close above $27.85B signals further upside.
📉 Risk Management
📊 Confirm Volume – Strong buying pressure above $27.85B before entering.
📈 Trailing Stop – Move SL to entry after TP1 ($28.86B).
💰 Partial Profits – Take 50% at $28.86B, let the rest run to $29.84B.
🚀 Trade smart, follow the plan & manage risk! 🔥 #Dogecoin #CryptoTrading #DOGEUSDT #BreakoutTrade #CryptoSignals


Cyclic Nature of Crypto - DOGEThis chart shows how cycle lines can be used to estimate potential short term trade opportunities in the crypto market. The key is to identify what price action is doing in order to pick an strategy that works for your trading style. Instead of quantifying directional based biases, measure time, cycle lengths, price ranges, and more. Many traders know what the measured move is. However time can also be measured to provide an edge.

$DOGE has a high probability to be in the US reserveIf the US were to establish a national crypto reserve that includes altcoins, CRYPTOCAP:DOGE should definitely be considered. Why? Because Musk is a strong advocate, and he won’t disappoint his billionaire buddy.
It’s as simple as that.
If CRYPTOCAP:DOGE makes it onto the list, expect a massive pump!

Dogecoin's Potential Resurgence: A Technical and Market AnalysisDogecoin, the meme-inspired cryptocurrency that has captured the attention of investors and enthusiasts alike, has recently shown signs of a potential resurgence. With its weekly Relative Strength Index (RSI) approaching the Moving Average (MA) line and recent price action suggesting fresh highs, the question on everyone's mind is: can Dogecoin resume its uptrend and break its all-time high (ATH) of $0.74? This article delves into the technical analysis, market trends, and underlying factors that could influence Dogecoin's price trajectory.
Technical Analysis: RSI and Price Action
The Relative Strength Index (RSI) is a momentum indicator used in technical analysis that measures the magnitude of recent price changes to evaluate overbought or oversold conditions in the price of a stock or other asset. When the RSI approaches the MA line, it often signals a potential shift in momentum. In Dogecoin's case, the weekly RSI approaching the MA line suggests that the cryptocurrency may be transitioning from a period of consolidation or correction to a renewed uptrend.
Furthermore, recent price action has been encouraging for Dogecoin enthusiasts. The cryptocurrency has shown signs of strength, with price movements suggesting the possibility of breaking through resistance levels and establishing fresh highs above $0.75. This positive price action, coupled with the RSI approaching the MA line, paints a bullish picture for Dogecoin's near-term future.
Market Trends and Influencing Factors
Several factors could be contributing to Dogecoin's recent surge and potential for further growth:
1. Increased Adoption and Utility: Dogecoin has seen increased adoption as a form of payment by various merchants and businesses. This growing utility adds real-world value to the cryptocurrency and could drive demand.
2. Social Media and Community Support: Dogecoin's strong community and social media presence play a significant role in its price movements. Positive sentiment and viral trends can lead to increased buying pressure and price appreciation.
3. Broader Cryptocurrency Market Trends: The overall health of the cryptocurrency market can also impact Dogecoin's price. A bullish trend in the broader market often lifts the prices of various cryptocurrencies, including Dogecoin.
4. Celebrity Endorsements and Influencer Marketing: Dogecoin has benefited from endorsements by celebrities and influencers, which can generate significant buzz and attract new investors.
Can Dogecoin Break its ATH?
While technical indicators and market trends suggest a positive outlook for Dogecoin, breaking its ATH of $0.74 will require sustained momentum and overcoming key resistance levels. The cryptocurrency has faced significant volatility in the past, and it is essential to consider the risks involved.
However, if Dogecoin can maintain its current trajectory, capitalize on positive market sentiment, and continue to grow its adoption and utility, breaking its ATH is a realistic possibility.
Conclusion
Dogecoin's recent price action and technical indicators suggest a potential resurgence for the meme-inspired cryptocurrency. With its weekly RSI approaching the MA line and price movements indicating fresh highs, Dogecoin could be poised for a renewed uptrend.
While breaking its ATH of $0.74 will be a significant challenge, the cryptocurrency's strong community, growing adoption, and positive market trends could provide the necessary impetus. As always, it is crucial to conduct thorough research and exercise caution when investing in cryptocurrencies, considering the inherent risks and volatility of the market.

Dogecoin: The People's Coin Don't underestimate the power of the Doge community! With a market cap of over $50 billion, Dogecoin (DOGE) is more than just a meme coin. It's a symbol of crypto's democratizing power and a testament to the strength of its devoted community.
Technical Analysis: Bull Flag Pattern
The Dogecoin (DOGE) chart is flashing a bullish signal, and it's time to take notice! Indicating a potential breakout to new highs.
Conclusion:
Target: .75.= $100Billion market cap

Daily CLS short playing down to the W CLS, FVG HTF KLDaily CLS short playing down to the W CLS, FVG HTF KL
Bullish if the weekly FVG supports the price and we get H4 CIOD back in to the Weekly CLS.
you are welcome to comment with your thoughts and share your charts or questions below, I like any constructive discussion.
What is CLS?
This company is trading for the biggest investment banks and central banks. They trade over 6.5 trillion daily volume. They are smart money of the all markets.
CLS operates in the specific times which will give you huge advantage and precisions to you entries. Focus on that. Its accuracy is amazing.
Good luck and I hope this educational post helps to become better trader
“Adapt what is useful, reject what is useless, and add what is specifically your own.”
Dave FX Hunter ⚔

One of the greatest runs? DOGETime will tell,It sounds just as crazy as 300M if I told you it was going to be 100B.

**DOGE Symmetrical Triangle Breakdown - Bulliesh Setup**
The **30-minute chart** for **DOGE** highlights a **symmetrical triangle breakdown**, signaling a bearish move.
- **Entry**: $53.12B (current level - yellow line)
- **Stop Loss (SL)**: $51.29B (white line - key support)
- **Target 1 (T1)**: $55.25B (red line - first resistance)
- **Target 2 (T2)**: $57.38B (green line - major resistance level)
**Watch closely** for price action around $53.12B. If volume increases and momentum sustains, this trade offers a solid risk-to-reward ratio. 📉
#DOGE #Crypto #Altcoins #TradingSetup #TechnicalAnalysis #CryptoMarket

Analyzing Dogecoin Futures Open Interest: What Does it Mean ?Dogecoin (DOGE), the memecoin that captured the world's imagination, has seen its future open interest reach an all-time high. This metric, which measures the total number of outstanding futures contracts, is often used as an indicator of market sentiment and potential price volatility. While this development might seem bullish at first glance, it could also be a warning sign for DOGE's price trajectory.
What Does High Open Interest Mean?
A high open interest in futures contracts indicates increased speculative activity around a particular asset. In the case of Dogecoin, this suggests that traders are taking significant positions, either long or short, on the cryptocurrency's future price movement.
On one hand, high open interest can be a bullish sign. It could mean that there is strong demand for Dogecoin, and traders are betting on its price to rise. However, it's important to consider the other side of the coin. High open interest can also indicate a potential for increased price volatility, as traders may be more likely to take profits or cut losses, leading to sharp price swings.
The Role of Elon Musk and Memecoin Momentum
Dogecoin's popularity has been significantly boosted by the support of high-profile figures like Elon Musk. Musk's tweets and endorsements have often sent the DOGE price soaring, attracting new investors and driving a speculative frenzy.
Moreover, the broader memecoin market has been experiencing a period of outperformance, with many memecoins recording significant price gains. This trend has further fueled interest in Dogecoin and contributed to its price rally.
Is a DOGE Price Top Imminent?
While the recent surge in Dogecoin's price and the all-time high in futures open interest are undoubtedly exciting, it's crucial to remain cautious. Several factors suggest that a price top might be nearing:
• Overbought Conditions: Technical indicators such as the Relative Strength Index (RSI) and the Moving Average Convergence Divergence (MACD) may be signaling overbought conditions, suggesting that the price may be due for a correction.
• Profit-Taking: As the price of Dogecoin rises, traders who have made significant profits may start to take some of their gains off the table. This selling pressure could lead to a price decline.
• Regulatory Uncertainty: The regulatory environment for cryptocurrencies remains uncertain, and any negative regulatory developments could have a significant impact on Dogecoin's price.
• Market Sentiment Shifts: The cryptocurrency market is highly volatile, and sentiment can shift rapidly. If investor sentiment turns bearish, it could lead to a sharp decline in Dogecoin's price.
Conclusion
While the high open interest in Dogecoin futures is a noteworthy development, it's essential to approach it with a balanced perspective. While it could indicate strong demand and potential for further price appreciation, it also highlights the increased risk of price volatility. As with any investment, it's crucial to conduct thorough research and consider the potential risks and rewards before making any decisions.
Investors should be mindful of the potential for a price correction and avoid making impulsive decisions based on short-term price fluctuations. A long-term investment approach, coupled with a solid understanding of the underlying technology and market dynamics, maybe the most prudent strategy for navigating the volatile world of cryptocurrencies.

WHATS NEXT FOR DOGS...OHH SORRY DOGEif market conditions are favorable and price breaks above the trendline line, target a 25.55B MCap... All prayers to mother BTC now

#DOGE/USDT#DOGE
The price is moving in a descending channel on a 1-day frame and is sticking to it very well and is about to break upwards
We have a bounce from the lower limit of the channel at a price of 12.86
We have an upward trend on the RSI indicator, which supports the rise
We have a trend to stabilize above the moving average 100
Entry price 14.45
First target 19.00
Second target 22.90
Third target 28.30

Doge/SolIn the twilight of the bull market, Dogecoin and Solana danced neck and neck, their market caps nearly aligned. But if history's echoes hold true, Doge could soar fourfold beyond Solana. Yet, Solana’s steady rise has crowned it a sanctuary of safe trades, where low risk promises modest rewards. Timing may waver, and Doge's allure remains, but wisdom whispers: time *in* the market beats timing *the* market. So, choose your course, but remember—the journey matters more than the moment. Good Luck!

DOGE - Diagonal price action There are no guarantees in the markets, only probabilities. I see the following 2 short-term probabilities:
On the 2-day timeframe we see an impulse structure. The fourth wave has already completed. According to Elliott Wave norms, it may go a little higher, but not significantly. The top could be the 0.174 EUR MAX mark.
According to the principle, the fifth wave may update the troughs a bit, or stop near the end of the third wave. The horizontal volume profile gives a good guide - a range between ~0.077 and 0.06 EUR.
A bit more globally, I view the whole structure as an Expanded End Diagonal formation. Therefore a strong reaction to EUR 0.47 is possible after the end of the 5th wave of the smaller degree, this is my base case scenario. Keep in mind, if you look at the picture on the 1D TF, the 5 way down structure is already completed!
Also remember that Waves act simultaneously on ALL degrees. So there is another possibility - when this 5-wave pattern works out, a more global degree will take effect, so the price may fall deeper than 0.06 EUR !!
:) The result, as always - there are not many probabilities - either UP or DOWN. So manage your risks and make fat profits !!!

Blockchain Volume DeclineWe build a robot that calculates and the daily total trading volume on the Dogecoin blockchain. Yesterday the blockchain volume fell from 9.2 billion to 7.6 billion.
pbs.twimg.com
Good luck in your trading and have a fat profit!
You can find my price action anticipation in previous postings.
