PUMP to 2$This chart displays a bullish outlook for DOGE/USD on the weekly timeframe. The current price is $0.33, with an EMA (50) at $0.19 signaling a strong uptrend 📊. The chart suggests a key support zone around $0.20, ideal for entries 📉, and targets an ambitious price of $2.06, indicating potential growth of over 500% 🚀. A descending wedge breakout and higher lows support the bullish thesis 📈. The RSI is at 67.35, close to overbought, hinting at momentum but also a need for caution ⚠️. A pullback near $0.20 could provide better risk-reward entry opportunities.
DOGEBEAR2021USD trade ideas

DOGE: Now that support got poked through....Sunday flash crash of the markets after the trade war announcements has made things rather interesting. So far, the uptrends have been intact, but some very important support levels have been breached temporarily; for all important markets, including the ES, NQ, BTC, Gold etc. For Doge, there are still a couple of bullish possibilities out there. Until price goes below $.12-$.10 zone, which is the secondary line of defense, higher prices may still be in the future.
Bull counts as of now:
1. 1/2, 1/2 setup. Probably the biggest bull case here. Will be confirmed only with a V recovery and price above $0.5 very quickly. This selloff should be a long wick on a daily, or rather a weekly chart and piece of historical reference. Price target will put Doge to $5 or beyond which should be a massive price explosion.
2. Ending diagonal. This count will be validated if price keeps on falling and slowly bottoms out at the secondary line of defense. Still should make an all-time high eventually but will take some time to grind out the bottom and slowly recover. Should give us $1 Doge but that would be it!
Bear case:
Still on Primary wave 4! That may give us some new lows below $0.08 and crush the hopes and dreams of many! As long as price doesn't fall below $0.018, macro bull market is still alive (maybe barely)! Will reassess if this happens....
Bottom line: Not panicking for one. Market will bounce after a severe selloff. At that point need to take some inventories and adjust.

DOGE: Can support hold?After breaking out of $0.18 area, Doge has made a nice 5 waves move. Now it is time to see if it was just another C wave to extend its dreaded multiyear correction, or if it is, in fact, the bull run that the bag holders have been waiting for years. I will not want to see Doge breaking below the $0.23 support area of March 2024 high. I would be perfect if Doge can bounce from 0.618 fib support area of $0.24. The next week or 2 will be crucial to see how price action evolves. Price will have to break below $0.12 to be really bearish. Until then, would like to see BTC and other top names put in the lows and start making new highs.

DOGE: "Probably Nothing..."The green line, DOGE rides to Olympus.
The red line, DOGE first visits Hades.
Which line forward, western DOGE?

Weekly BearishMACD is bearish
Stochastic RSI is bearish
Hopefully the FVG can stop the bearish activity.
Price is currently moving down a downward parallel channel.
Please see chart for key levels and keep an eye on the .22 price range for hopeful reversal with a bullish MACD cross over.

Dogecoin Trading in a RangeDogecoin is trading in a range as shown.
I consider this downward movement to be a good sign of incoming bullish movement, why?
Because February candle just opened and the current downward movement is building a monthly bottom wick.
This is a buy the dip scenario.

A lesson in cyclesKey: Notice that Volatility is meant to throw you OFF the real trend. Easy mode is in the second half of the sub-phase.
Phase 1 : Markdown
Characterized by a clear downward trend
Despite showing volatility spikes, the true move is consistently downward
The volatility markers appear to coincide with temporary price jumps, but these are false signals
Phase 2 : Accumulation/Consolidation
Shows a period of sideways movement
Multiple volatility markers appear during this phase
The "True move" indicators show this is actually a period of quiet accumulation, despite the volatile spikes trying to suggest otherwise
Phase 3 : Markup
Shows an upward trend developing
Again, volatility markers appear to create noise
The "True move" indicators reveal the genuine upward trajectory beneath the volatile price action
Smart money:
1) First pushes prices down (Markdown)
2) Quietly accumulates during a consolidation period
3) Then allows prices to rise (Markup)
4) Distributes at highs.

DOGE! time for new ATHHallo traders !!
After a long time of waiting, a new chance for profits arises :) according to the plan, we are a month ahead of growth. I wish you perseverance! and certainly, as in previous years, the portfolios are getting thicker!
I invite you to follow :) as you know, I only appear when something is happening.

DOGEUSD Bulish Outlook!It seems I've overlooked the robust support for this pair; it made a beautiful bounce but didn't retest the respected structure. However, I wouldn't be surprised if it attempts to do so again before turning bullish. I'm anticipating a range of 0.35 to 0.37 before we identify a strong resistance area.
I want to clarify that I'm not sharing this information as trading signals or entry points. I typically don't provide trading signals for either crypto or forex, although I may consider it in the future.

Short term Possible double correction in progress, looking for more upside as long as current lows hold

New to Technical Analysis. Go easy on me!After the 5th Wave here on my charts you can see that it looks like we are forming a contracting triangle pattern. I guess the only thing that would invalidate my idea here would be if we lose the levels that we are currently at. Would like to see us push back up from here and finish out the D Wave.

DOGE/USD: Testing Key Levels Amid Weak Momentum🔥 FinCaesar Strategy:
🩸 Short: Below $0.32, targeting $0.31 and $0.30. The MACD remains weak, and the price is trading below key moving averages, increasing bearish risk.
🩸 Long: Above $0.33, aiming for $0.34 and $0.37. Bulls need a strong volume breakout to regain momentum.
🔥 FinCaesar Commands:
🩸 Resistance: $0.33 — A breakout above this level could push DOGE toward $0.34 and beyond.
🩸 Support: $0.32 — Losing this level may result in a pullback to $0.31 or lower.
Dogecoin is showing signs of consolidation, but bearish momentum persists. The MACD is struggling to turn bullish, and price action suggests hesitation. Bulls need a push above $0.33 for a potential breakout, while failure to hold $0.32 could lead to further downside.
👑 "In uncertain markets, only the bold dictate the future." — FinCaesar

DOGEDOGE giga support at .3
$1 on the next leg higher (the warmup)
In hindsight, it will be so obvious

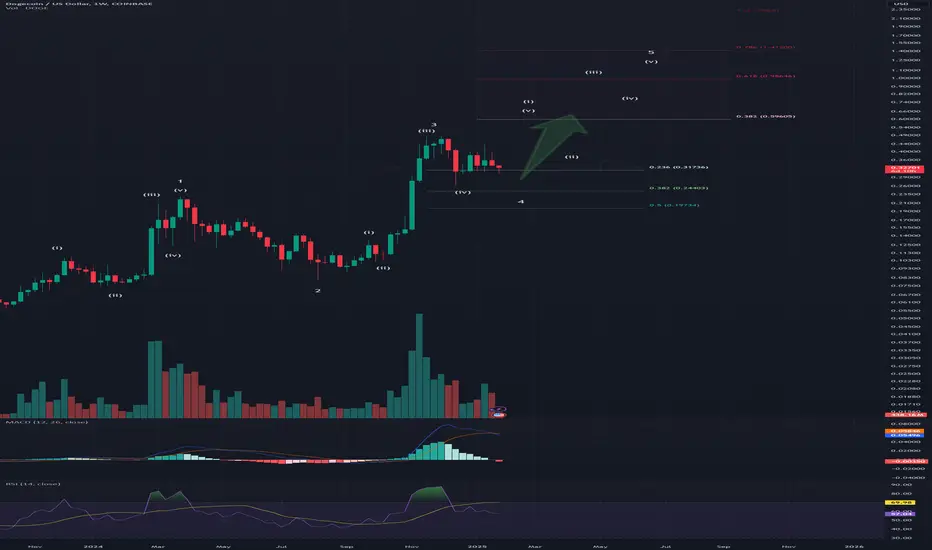
DOGE/USDT Weekly Chart (Updated)Detailed Analysis of DOGE/USDT Weekly Chart (Updated)
DOGE/USDT is currently navigating a critical consolidation phase within Wave 4, as per the Elliott Wave framework. Below is a detailed breakdown of its technical structure, including key levels and momentum indicators.
1. Elliott Wave Count
DOGE is in a corrective Wave 4 phase, following a strong impulsive Wave 3, which aligns with the Elliott Wave guidelines:
Wave 1 was the initial impulsive move marking the beginning of the trend.
Wave 2 retraced deeply but respected key Fibonacci retracement levels, establishing a foundation for Wave 3.
Wave 3 was the most extended and powerful wave, as evidenced by a steep rise in price and volume, peaking near $0.523.
Wave 4:
Currently forming a correction, likely a flat or triangle structure.
Typical of Wave 4, the correction is shallow compared to Wave 2, adhering to the guideline of alternation.
Consolidating within the 23.6%–50% Fibonacci retracement levels of Wave 3.
2. Fibonacci Retracement Levels
Wave 4 correction is respecting Fibonacci retracement levels:
23.6% retracement ($0.31736): Currently acting as a key resistance.
38.2% retracement ($0.24403): A strong support zone for potential reversal and Wave 5 initiation.
50% retracement ($0.19734): A critical level of last-resort support; a breakdown here could invalidate the current Elliott Wave structure.
3. Wave 5 Projection
Upon completion of Wave 4, DOGE is expected to begin its final impulsive Wave 5. Probable targets based on Fibonacci extensions:
0.618 extension ($0.89646): Primary target, aligning with typical Wave 5 behavior.
0.786 extension ($1.412): Secondary target, achievable under strong bullish conditions.
1.0 extension ($2.229): A highly optimistic target, representing significant bullish momentum or speculative fervor.
Wave 5 is likely to retest the previous Wave 3 peak ($0.523) before advancing to higher Fibonacci extension levels.
4. Volume Analysis
Volume behavior reflects the consolidative nature of Wave 4:
Volume has declined since the Wave 3 peak, indicating reduced market activity—a common characteristic of corrective waves.
A volume breakout above the recent average will serve as a confirmation of the transition from Wave 4 to Wave 5.
5. MACD Indicator
The MACD histogram remains in the negative zone but shows signs of shrinking, indicating that bearish momentum is weakening.
The MACD lines are approaching a potential bullish crossover:
A crossover above the signal line will confirm the start of bullish momentum for Wave 5.
6. RSI (Relative Strength Index)
The RSI is currently at 56.79, within the neutral-to-bullish zone:
This indicates a lack of extreme momentum but leaves room for further acceleration.
A breakout above 70 during Wave 5 would confirm strong bullish momentum.
7. Key Levels to Watch
Support Levels:
$0.31736 (23.6% Fibonacci retracement): Current resistance; a breakout above this level signals strength.
$0.24403 (38.2% Fibonacci retracement): A strong support level where Wave 4 could end.
$0.19734 (50% Fibonacci retracement): Last-resort support; breaking below this invalidates the wave structure.
Resistance Levels:
$0.523 (Wave 3 peak): The first key resistance to break for Wave 5 confirmation.
$0.89646 (0.618 extension): Primary target for Wave 5.
$1.412 (0.786 extension): Secondary target, indicating extended bullish momentum.
8. Risk and Invalidations
Break Below $0.24403: Suggests deeper retracement toward $0.19734.
Break Below $0.19734: Invalidates the current Elliott Wave structure, signaling potential further downside.
Broader Market Sentiment: DOGE's movement will likely be influenced by the overall cryptocurrency market sentiment, making external factors (e.g., BTC dominance, macroeconomic conditions) crucial to monitor.
9. Confluence Factors for Wave 5 Confirmation
A breakout above $0.31736 with high volume.
A bullish MACD crossover above the signal line.
RSI moving into the 70+ zone, signaling strong upward momentum.
Conclusion
DOGE/USDT is currently consolidating within a Wave 4 corrective phase, hovering around key Fibonacci retracement levels. If the price respects the $0.24403 support and breaks above $0.31736, it is likely to enter Wave 5, targeting $0.89646 (0.618 extension), with stretch targets at $1.412 (0.786 extension). Risk lies in a break below $0.19734, which would invalidate the wave structure.
Let me know if you’d like further analysis or adjustments!
Trading Signal : DOGECOIN ($DOGE) -1D - BREAKOUTTechnical Analysis:
Price remains in a strong Uptrend across all timeframes. Recently, it broke above the $0.37 resistance and prior swing high, signaling renewed bullish momentum. The presence of a Dragonfly Doji at this breakout level reinforces the bullish case, as the long lower wick indicates that sellers pushed the price lower but were overpowered by buyers. Momentum remains positive, as the MACD Line is above the Signal Line, and the RSI confirms the price is not yet overbought (RSI < 70). The breakout positions the price to target the next key resistance at $0.48, with potential for further upside if bullish conditions persist.
Entry Zone:
Enter on a confirmed breakout above $0.37, or on a pullback and retest of this level as new support.
Targets (Take Profit):
TP1: $0.48 (+30%).
TP2: $0.55 (if bullish momentum continues).
Stop Loss:
Below $0.35 to limit downside risk.
This notification constitutes a marketing communication. The information provided does not constitute a recommendation, offer, or solicitation to buy or sell any crypto-asset. It is not intended as investment advice, and no consideration has been given to the specific investment objectives, financial situation, or individual needs of any recipient. Any decision to act on the information provided is made at the sole discretion of the recipient. SwissBorg disclaims any liability for losses arising from the use of this material. Recipients should consult their own professional advisors before making investment decisions.

Doge will pull back(bulls waiting on the sidelines)So this is my theory, I am a huge believer that doge, eth, ada, and various other cryptos with a large market cap follow bitcoin
What this means:
bitcoin at the top of a trading range, meaning it will pull back down soon
doge will get dragged down with bitcoin, the only difference is that doge is already on a bear trend and I’m already waiting on a second leg
The strategy is marked up on the chart, I’m a bull and I’m just waiting to load the boat at .20-.25 cents — I believe this is where doge will consolidate before Elon and Donald trump start hyping it up.

DOGEUSDT Start of a new trend, towards all time highs.DOGECOIN has broken this beautiful flag & currently retesting on Daily TF. Time to load up. If you are taking a short term trade, don't take more than 5% risk. I own a lot of it, Not a financial advice.

DogeCoin (DOGE) To Mars - The Elon Ride (Part 2)COINBASE:DOGEUSD has been loyal to me previously.
I managed to get some good Buys on #DOGE.
I aped continuously on the 7 Cents Levels.
Then cashed all my COINBASE:DOGEUSD earnings at the 42 Cents #Resistance.
* all well documented in the related idea.
What Happened To BINANCE:DOGEUSDT ?
It provided to #Correction I was predicting.
From a #Fibonacci perspective, it's enough to be considered as an #ElliottWave 2.
What's Next For BINANCE:DOGEUSDC ?
$DogeCoin follows MARKETSCOM:BITCOIN and the #Altseason.
With BITSTAMP:BTCUSD about to burst again, so will #DOGECOIN.
It might go #Bull now, or Dip and then... so please DYOR.
The #Bullish move would also be provided by CRYPTOCAP:TOTAL3 & CRYPTOCAP:OTHERS , as a new #ATH is in play.
* see related ideas for more details.
COINBASE:DOGEUSD #TechnicalAnalysis
- #ElliottWave A-B-C Sequence
- #Impulse / #MotiveWave in Primary ⓒ (white)
- #Fibonacci Retracements & Extensions Confluence
My #HODL #Long Levels For BINANCE:DOGEUSDT
I will only go #HODL for this #Crypto #Token.
Trading #Futures ( BINANCE:DOGEUSDT.P ) is not something I want to pursue with $DOGE.
Moderate Entry @ 35 Cents
Conservative Entry @ 24 Cents
TP @ 68 Cents

$DOGE Update#DOGE is still on repeat in 2021.
So far, just like with #Bitcoin, I expect a correction to the previous bottom during the weekend.
After this I expect with a bit of luck that we can x4 from the previous run.
For now, let's see if we will actually leave and what we will do around 1 dollar.
Be kind to the world and each other

DOGE about to rally on Double Bottom Bullish Cross signalDogecoin (DOGEUSD) has been trading within a Channel Up pattern since the December 20 2024 bottom. A very distinct buy signal emerges every time the price makes a Double Bottom near the Higher Lows trend-line of the pattern and the 4H MACD forms two Bullish Crosses in a row.
As you can see, this has already happened two times, with the price reaching at least the 2.618 Fibonacci extension for a Higher High and this is the 3rd time within the Channel Up that we see this indicator combo.
As a result, we turn bullish short-term, targeting 0.43250 (Fib 2.618 ext).
-------------------------------------------------------------------------------
** Please LIKE 👍, FOLLOW ✅, SHARE 🙌 and COMMENT ✍ if you enjoy this idea! Also share your ideas and charts in the comments section below! This is best way to keep it relevant, support us, keep the content here free and allow the idea to reach as many people as possible. **
-------------------------------------------------------------------------------
💸💸💸💸💸💸
👇 👇 👇 👇 👇 👇

DOGE/USD Approaching Key Support Level**📊**
- **SL (Stop-Loss)**: $0.33548 🔴
- **Entry**: $0.34618 🟡
- **T1 (Target 1)**: $0.35865 🟢
- **T2 (Target 2)**: $0.37402 🟢
💹🐶

The Secret Fibonacci pockets on DogecoinIt has been a while since i posted something here.
Thank you for still following me.
I had a macro look at dogecoin using my previously published secret about the 9-10.618 Fib and thought to share my findings with you.
First have a look and see the targets given by my custom fibonaci template which shows the area of 9-10.618
notice how precise it calls the macro tops
see how i place the tool
the blue arrows showing a equal date range of 174 weekly bars
what do you think? could this be the plan?

An Educational Journey into Technical Analysis with Dogecoin/USDIn this tutorial, we'll dive deep into the art of technical analysis using the Dogecoin USD chart as our canvas. You'll discover how to blend Fibonacci tools, Elliott Wave Theory, and the Wyckoff Method to forecast potential market movements. Whether you're new to trading or looking to refine your analytical skills, this guide will provide you with practical insights into identifying entry and exit points, understanding market phases, and preparing for future trends. Let's embark on this educational journey together to enhance your trading strategy toolkit.
When in doubt, Zoom Out!
Below I was looking at Arguments for a Significant Short Position Before the Continuation of the Bullish Trend and the Pursuit of New All-Time Highs
Elliott Waves: From the bear market bottom at 4.5 cents, we started wave 1 and concluded with wave 5 at the current top. Following five waves, we expect an ABC correction. Waves A and B have been completed, and we are now in wave C.
Fibonacci 1: Trend-Based Fibonacci Extension - From the all-time high (ATH) to the recent bear market bottom, then to the current 48-cent top. The 0.382 Fibonacci level suggests a target of 0.2130 for the upcoming drop, which I believe is necessary for liquidity ahead of the next upward movement.
Fibonacci 2: Regular Fibonacci Retracement - From the bottom of wave 4 to the top of wave 5, the 0.618 level is at 0.235 cents. I've marked a green box between these two targets.
See in the image below how Backtesting this strategy on the two previous cycles shows that before breaking ATHs, Dogecoin always hit this 0.382 Fib level!
I use these 2 Fibonacci targets to place the green box between them and where I expect price to go in the newxt couple of weeks.
Additional Observation: The green line below the 0.618 Fib retracement and above the 0.382 trend-based Fibonacci extension also marks a retest of the wave 3 high at 0.23 cents.
Now that we've examined the macro perspective, let's Zoom In to the current action:
Wyckoff Schematic: Check my previously published idea on Bitcoin, linked here, where Bitcoin is in a Wyckoff Distribution Schematic #1. Dogecoin seems to follow with Wyckoff Distribution Schematic #2. I've added vertical lines for phase separation, a red resistance box, and a green support box.
Link to Richard D. Wyckoff, his Method and Story www.wyckoffanalytics.com .
ABC Pattern: Wave A from top to bottom is exactly 0.222 cents or -45.81%, suggesting wave C should be of similar magnitude. Wave B measures 0.1724 cents and 65.65% to the upside. Using an arrow tool, the 0.222 cent drop points exactly to the 0.382 Fibonacci target from the trend-based extension we did in the macro analysis, now highlighted in yellow. Link to chart.
Zooming in on the 4-hour Chart: I've drawn another Fibonacci retracement just for wave B, colored in turquoise blue. Notably, the 1.272 Fibonacci extension aligns with our macro 0.382 Fibonacci target, now colored yellow for clarity.
Speculations for Future Moves:
Fibonacci Circle and bottom timing prediction: Drawn from A to B, this circle in orange might help us predict when we hit the green box target at the bottom. Considering that the A drop measures exactly 12 days and 4Hours I have added another vertical line now marking a timeframe of 5 days from Thursday 30 January to Monday 3 February 2025 This is speculative but worth watching. It includes also a weekend so a CME gap before weekend plus filling the week after could also be in play.
Wyckoff Phases: According to earlier discussions, we're moving through phases A to E. I've added a vertical line where the Fib circle crosses our 1.272 and 0.382 Fib levels, suggesting we'll enter phase E on January 23, 2025, potentially concluding by February 2, 2025.
Predictive Arrows: Blue arrows indicate possible future price movements based on current patterns.
After hitting our target, I'll analyze again and publish a new idea with plans for breaking the ATH and targets for the anticipated bull market.
Enough for now, as it's getting late. Give me a follow, share if you liked this analysis, and stay tuned for updates.
