DOGEBTC trade ideas


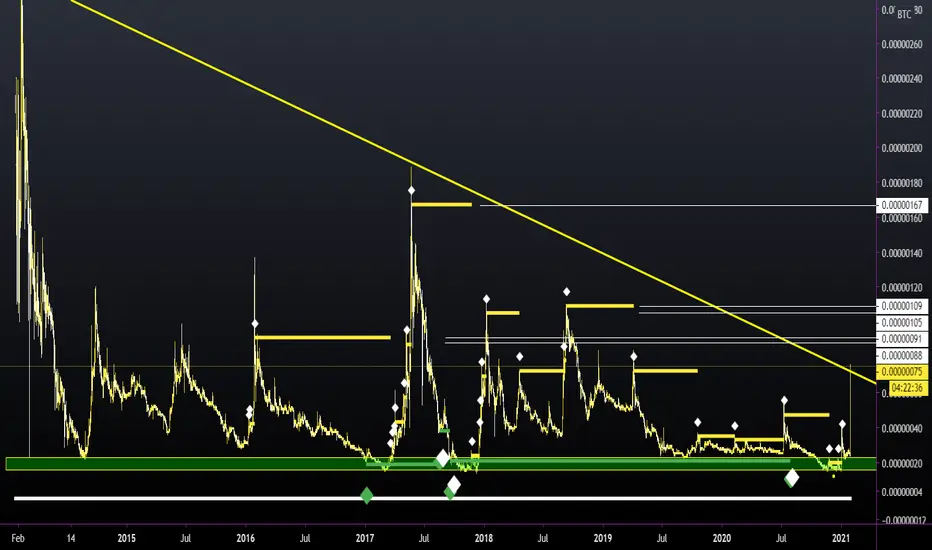
targets on doge took lots of profits off the table at downtrend resistance .we are breaking out could this be future targets?
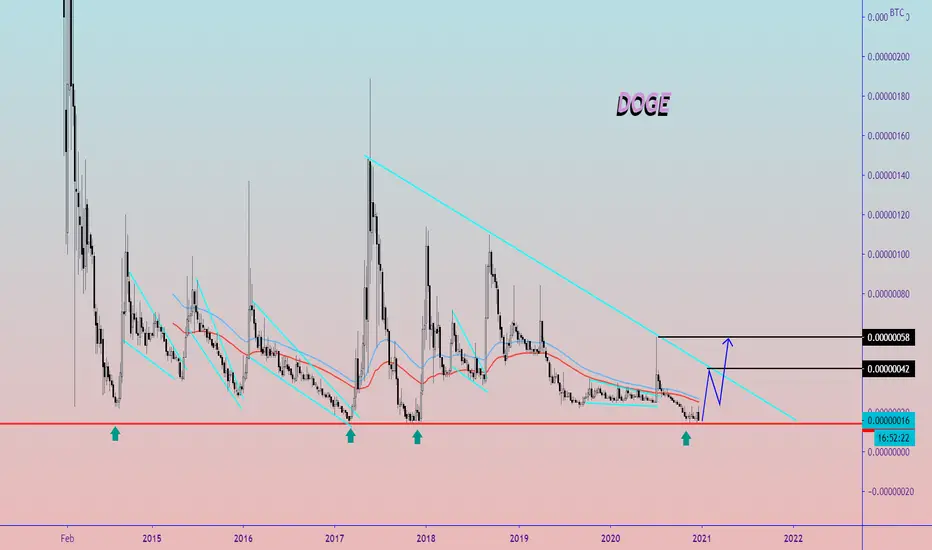
Dogecoin (DOGE) More Bullish Now! This Is It!The Dogecoin (DOGEBTC) chart looks just like it looked a month ago but stronger after a retest of the 15 satoshis low.
It looks like this is it and from here on prices can start to grow.
The consolidation/accumulation phase can be tricky as sometimes it can take just days before the bullish breakout takes place but can also take months or weeks...
After double testing the lower support, with increasing volume, strong bullish action for Bitcoin and other altcoins... THIS IS IT !
Wait for a strong jump next... Followed by more.
Here I mapped an easy 160% target but the potential is much higher.
Namaste.
Previous chart from Nov 22

Dogecoin: Hope you like pets🐕 vrs. 2 😉Hello, my dear friends! Not long time ago, I made 👇 this post for You!
Hope, that You are with me from that time and already fixed some profits!💪
For those, who aren't I made this post with re-entry point, because it's not too late.
You can Buy in orange zone levels 30-35-38
take profits levels You can find on the chart!
Enjoy Your trading 😻
Thank you for staying with me🧡
Sincerely Yours Rocket Bomb🚀💣


DOGE pump and dump / is this a start of alt season?OK, so we all saw this pump and dump manipulation by whales - typically lot of news at twitter to catch ppl emotions and start fomo buying - If u want to be succsefull trader, u should avoid emotions otherwise u will lose your previous gains and end it up with loss and head full of stress
What happened basically - price went parabolic - parabolic move is not healthly move in trading = as fast it went up that fast it will go down again
Price broke 58-62 area which was previous resistance and did another 40% to 86 (total 300%+) - another resistance...till we are under 62, we might not see another pump - but it all depends on whales
Green area is another Support which should hold for another move up. It is hard to say if this will go up or needs some time for rebreath -i dont like pump and dumps - hard to predicts anything ....basically it's from hero to zero very often sadly
And now i would like to guess few thought in YOUR HEAD during this pump
- institutionals twitter accounts are posting only about DOGE - MOON - USDto DOGE and other bullsh.. (in fact they need you to fomo because they will sell to you their big bags of coins at great price - thanks to twitter hype and FOMO - dont be stupid they bought it weeks ago, not now)
- moon lambo
- great it can go to 200 sat
- it is still going up
- ok should i sell i see first red candles on minute chart
- oh no it is still going up, i am safe
- wtf is happening is it dropping now? should i sell at 80?
- oh no it is at 60 now i am sad that i didnt sell it at 74
- ok selling now at 55, good profits
- oh sh..it is going back up, 65 lets buy it with market buy
- nooo it dropped again to 52 and i am in loss:(
- my profits are gone, what should i do now
- emotions, emotions, emotions, feeling bad etc
I am here to help you so we can discuss it in comments if u want
NOT FINANCIAL ADVICE
EDUCATIONAL PURPOSE


Dogecoin - Dog is bull nowThe plain and simple explanation of some real bullish uptrend in makes
The idea doesn't assume we will go for new ATH but it's rather a guide through possible outcomes
Most of what we see right now is bullish breakouts happening across the chart with proper historical sentiment for past years.
But again, Bitcoin was not $30K+ back then, so I would focus USD pair of DOGE and treat this idea as a proper guide instead.
All the best,
@KRMA_0

Oh GODe... DOGe! Is this really happening?
Anything is possible now.
DOGE may turn out to be the new cripto gamestop?
DOGE at 1 dollar?
Im here to see!


$DOGE Valhalla is beautiful When going to a much larger time frame you will see we are at a key placement we have bullish momentum but we are at the moment going through sell pressure though it’s much weaker showing that we tested the ceiling 28 Sats
we just hit 25 sats key support
this was sponsored by a private client
Once we crack that which we will retest in a 6 days or more we rally really hard for a long time this is basically bloody February early (last buy in )


DOGE/BTC (1 hour graph) Possible bullflagDoge is forming a symmetrical triangle pattern on the 1 hour graph.
Recent events like mister Musk's tweets are still floating around in the thoughts of the masses.
Doge trading around strong historical support level.
Possible break out incoming
A new tweet of mister Musk could boost the breakout.
Wait for confirmation bullflag

#DogeBTC - Is the outperformance coming? $Doge #tradingviewIs Doge outperforming bitcoin now?
Not much is missing and the indicators already suggest the breakout.
But not only from Dogecoin.
I also see this with other coins.
Greetings from Hannover
Stefan Bode


DOGECOIN looks ready to blast off againDoge is about to break out of the symmetrical triangle on the BTC pair. Showing a nice descending volume profile and looks like buyers are slowly stepping in for the next leg up. 60 sats looks like a conservative target

Dogecoin (Can hold monthly support ?)DOGE / BTC
The last Bullish move was Impressive
Dogecoin jumped from previous low at 15 sat to 40 sat (more than 150% gains)
Now looking at Monthly chart :
Its Important for bulls hold above Monthly key support level (23-27 SATs) to remain in Bullish momentum
If bulls successed to hold that support there will be a chance to break strong trendline resistance that i draw in my chart.. after that we will enter moon phase with the targets according to fibonacci (grey color )
🚨 Invalidation : if Monthly support broken by weekly or monthly candel closing below, it can drop making new low
If you like my ideas
support me by likes comments and follow
Good luck 🤞

High Risk/High Reward trade on DOGE/BTCNot financial advice. Trading crypto has a high risk associated with it, and DOGE is a prime example. DOGE has this annual pump tendency and I believe it may replay the pattern from last year. Targets shown in cyan. Stop-loss shown in pink. Good luck broskis.

Doge/BTC guaranteed targets Here are the targets.
Buy Price 26 to 28
Sell at any target you prefer from those three.
The first target is the safest one.
Target 2 also possible
Target 3 is the new record that doge going to, will it be in this run, not sure. But if the pattern continues then yes it will be in this run season.

#DOGEBTC (watchlist)What we mean by Add this coin to the watchlist ?! 👀
This means the coin we mentioned shows a reversal pattern or moving near a historical bottom, around or above good support, increase in trading volume, accumulation stage, etc, so, we tell you to keep your eyes on this coin until the right time for entry and buy.
Ps:
-Our Charts here to give you an idea about coin movement (not buy or sell signal) so before following any idea be sure to do your own research, and follow risk management.
We ask Allah reconcile and repay
Watching the pupper $DOGEMarked are key zones, hoping pupper comes through with the goodies!
If there's no significant trend reversal at 7700-7800sats, expect dogberg at ATH ;)
