$DOGE- TEST, 4H : #3THIS IS NOT FINANCIAL ADVICE.
________________________________________________________________________________________________________
I am trying to visualize the price action as if I were entering a position based on the data until I am confident enough to do it in the market.
DISCLAIMER: I AM PERSONALLY GOING LONG WITH DOGE BUT WANT TO TRACK/TAKE NOTE OF PRICE MOVEMENTS IN DIFFERENT SCENARIOS, MORE THAN ANYTHING ELSE, WHILE LEARNING TO USE THE TOOLBOX + LEARNING TECHNICAL ANALYSIS.
These are just theories I am testing out to see what I need to adjust based on results.
________________________________________________________________________________________________________
Leave me a comment if you see something I need to change, I'd appreciate it.
DOGEBTC trade ideas

$DOGE- TEST, 30M : #1Looks like I had a trendline wrong for a few days. think it's right now. Literally everything has been updated/moved.
________________________________________________________________________________________________________
I am trying to visualize the price action as if I were entering a position based on the data until I am confident enough to do it in the market.
DISCLAIMER: I AM PERSONALLY GOING LONG WITH DOGE BUT WANT TO TRACK/TAKE NOTE OF PRICE MOVEMENT IN DIFFERENT SCENARIOS, MORE THAN ANYTHING ELSE, WHILE LEARNING TO USE THE TOOLBOX + LEARNING TECHNICAL ANALYSIS .
These are just theories I am testing out to see what I need to adjust based on results.
________________________________________________________________________________________________________
Leave me a comment if you see something I need to change, I'd appreciate it.
THIS IS NOT FINANCIAL ADVICE.

$DOGE- TEST, 4H : #3________________________________________________________________________________________________________
I am trying to visualize the price action as if I were entering a position based on the data until I am confident enough to do it in the market.
DISCLAIMER: I AM PERSONALLY GOING LONG WITH DOGE BUT WANT TO TRACK/TAKE NOTE OF PRICE MOVEMENT IN DIFFERENT SCENARIOS, MORE THAN ANYTHING ELSE, WHILE LEARNING TO USE THE TOOLBOX + LEARNING TECHNICAL ANALYSIS .
These are just theories I am testing out to see what I need to adjust based on results.
________________________________________________________________________________________________________
Leave me a comment if you see something I need to change, I'd appreciate it.
THIS IS NOT FINANCIAL ADVICE.
DOGEBTCWhen will the pump group let this DOGE die....
May be wishful, but I'm eyeing 67 sat before any dead cat bounce.

$DOGE- TEST, 4H : #2 (UPDATED)Morning, guys.
Hate to be the bearer of bad news but ZB went from 2nd, with a modest lead over 3rd, to almost dead last in traffic since this chart was made. Disapointing to see their traffic slashed by 90% vs. the peak (since the debut of Doge on their exchange). Looks the shiny new toy got old fast after the gains stopped being automatic. I'm sure it''ll pick up once the gains start coming back but to what extent? It was more than doubling Gate easily at the peak for the first few days. Another thing I noticed is how badly Doge is doing on US exchanges but better in foreign exchanges. That should change as Bittrex added another pairing recently. Either way, nice dips presented themselves recently and still do ATM and the trend is still favorable as a massive pullback was needed after the insane run Doge has had.
________________________________________________________________________________________________________
I am trying to visualize the price action as if I were entering a position based on the data until I am confident enough to do it in the market.
DISCLAIMER: I AM PERSONALLY GOING LONG WITH DOGE BUT WANT TO TRACK/TAKE NOTE OF PRICE MOVEMENT IN DIFFERENT SCENARIOS, MORE THAN ANYTHING ELSE, WHILE LEARNING TO USE THE TOOLBOX + LEARNING TECHNICAL ANALYSIS .
These are just theories I am testing out to see what I need to adjust based on results.
________________________________________________________________________________________________________
Leave me a comment if you see something I need to change, I'd appreciate it.
THIS IS NOT FINANCIAL ADVICE.

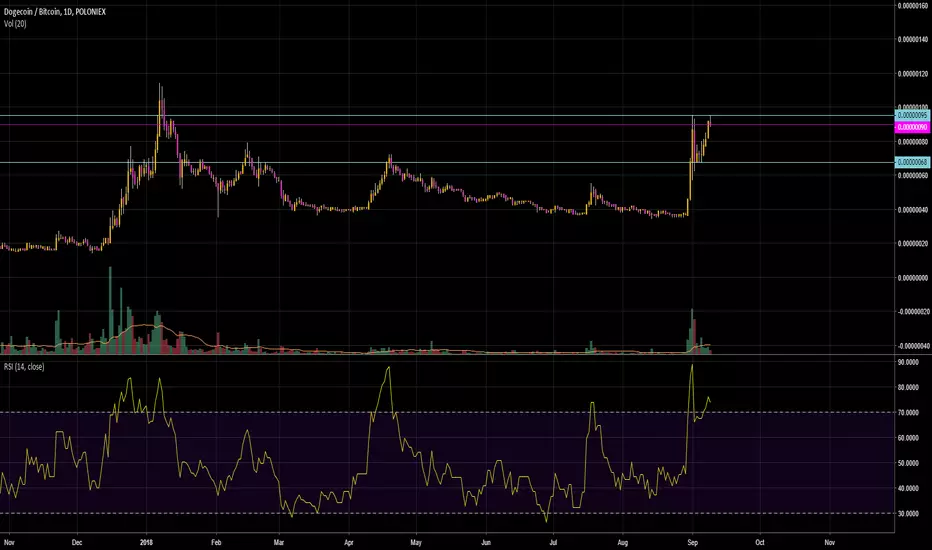
The Three Waves of Doge are concluding w/ a last coming bangThe 2-year cycle is coming to a close, with this year's final pump resulting in a high of 226 (+/- 15). Don't get scared with the recent small consolidation. The traders who actually do their homework, instead of drawing pretty triangles on drag and drop charts, the good traders have looked up the top wallets, for Doge - and all of them are off exchanges, slowly accumulating doge by millions every day. THE REASON PRICE IS NOT GOING UP RIGHT NOW IS BECAUSE THE WHALES ARE ACCUMULATING IN AN EXTREMELY INTELLIGENT AND PROFITABLE (FOR THEM) WAY. Weak hands are letting go of their Doge, the whales are scooping it up. Why are they buying it? Because doubling their BTC stack is the ultimate goal. 200+ within days/weeks. Stay long my friends.

$DOGE- TEST, 4H : # 1Trying out longer timeframes. Hope you guys correct me if something is incorrect, thanks.
________________________________________________________________________________________________________
I am trying to visualize the price action as if I were entering a position based on the data until I am confident enough to do it in the market.
I AM PERSONALLY GOING LONG WITH DOGE BUT WANT TO TRACK/TAKE NOTE OF PRICE MOVEMENT IN DIFFERENT SCENARIOS, MORE THAN ANYTHING ELSE, WHILE LEARNING TO USE THE TOOLBOX + LEARNING TECHNICAL ANALYSIS .
________________________________________________________________________________________________________
These are just theories I am testing out to see what I need to adjust based on results.
Leave me a comment if you see something I need to change, I'd appreciate it.
THIS IS NOT FINANCIAL ADVICE.

$DOGEBTC: Golden Cross approaching; Holding that 0.0...68 level.Update: 9/6 3:47pm ET.
Trying to hold and break above the resistance 1 level.
Like to see more volume come into play here.
Golden Cross is imminent with the 50 closing in on the
200 (SMA). Thus far looking strong with room to if, should it
choose to do so. Keep an eye on those upper wicks showing
supply. Bulls doing a good job holding the demand area of
0.0...68.

DOGE/BTCTrend is not over yet, so I'll continue riding it.
Very good time to take profit. HORRIBLE time to try to short.
ALWAYS wait for the insiders to reverse the market.

DOGE/BTCShort from this point on Poloniex with 2.5x leverage
Stop Loss - 106-107 sat. or 111 sat.
Take Profit - 1st target 70-80 sat.
2nd target 50 sat.

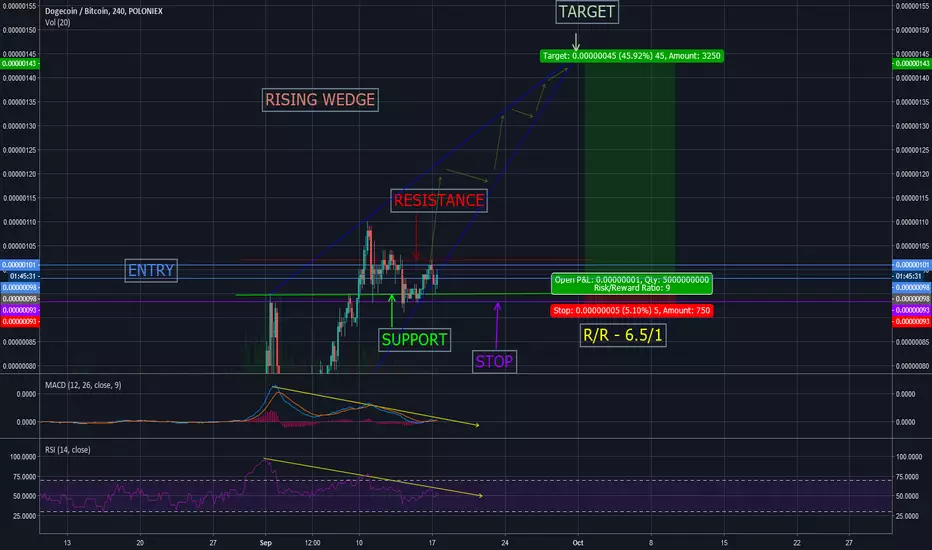
$DOGE- TEST, 1H : # 7 (S + P/L ERRORS ADJUSTED)Didn't work out the way I thought it would in the last test. The support has been moved up. The bottom of the blue rectangle is the new entry point and the top of it is the target. At this point, I thought we'd be above the trendline. Currently, we are just below it. R/R is almost 2:1.
Since the massive pullback after the 11th, DOGE has been slowly climbing back up and with ZB exchange now offering DOGE to China since 2 days ago, I believe this will be a massive boost to Doge traffic. In the first few days of having multiple DOGE pairings, ZB has managed to more than 2x Gate.io's traffic leading volume... at times, closer to 2.5x. The fact that the traffic is now smashing Gate.io's traffic for 3 straight days out of 3 days is very telling, IMO. ZB alone beats lowers spots #3 - #7 in traffic combined on a daily basis. That is pretty incredible for an exchange to more than 2x the Doge traffic leader right out of the gate, for 3 days straight.
Small sample size but I have been keeping track of volume for weeks now and I can tell you that in the past week or so, traffic has close to doubled overall, from top to bottom. This is quite the opposite of what I was expecting as the Dogethereum test was successfully passed over a week ago and the traffic seemed unaffected for the most part. I guess word travels slowly outside of the U.S.
Many are quick to point out Doge is a meme coin and this is true, it did begin as one... but to say it is worthless/has no real-use cases is incredibly inaccurate. There are plenty of reasons to believe in the short/long term... especially at current prices. Many have already made 50%+ returns easily... in a matter of weeks... in a bear market, as 99% of the market lost massive equity. I believe that this is just the start. Whether the bull-run begins or not, I can see Doge continuing to make gains as a lot of the CT world still overlooks Doge for different reasons, especially here in the States. I think this gives us more time to load up than usual... that is, until Doge goes on another tear.
________________________________________________________________________________________________________
I am trying to visualize the price action as if I were entering a position based on the data until I am confident enough to do it in the market.
I AM PERSONALLY GOING LONG WITH DOGE BUT WANT TO TRACK/TAKE NOTE OF PRICE MOVEMENT IN DIFFERENT SCENARIOS, MORE THAN ANYTHING ELSE, WHILE LEARNING TO USE THE TOOLBOX + LEARNING TECHNICAL ANALYSIS .
________________________________________________________________________________________________________
These are just theories I am testing out to see what I need to adjust based on results.
Leave me a comment if you see something I need to change, I'd appreciate it.
THIS IS NOT FINANCIAL ADVICE.


$DOGE- TEST, 1H : # 6 (P/L ERRORS FIXED... AGAIN)Can't figure out why I can't get the P/L chart where I want it so now I'm using this rectangle to show potential gains.
Pretty sure something is off but I need feedback, so here goes nothing.
________________________________________________________________________________________________________
I am trying to visualize the price action as if I were entering a position based on the data until I am confident enough to do it in the market.
I AM PERSONALLY GOING LONG WITH DOGE BUT WANT TO TRACK/TAKE NOTE OF PRICE MOVEMENT IN DIFFERENT SCENARIOS, MORE THAN ANYTHING ELSE, WHILE LEARNING TO USE THE TOOLBOX + LEARNING TECHNICAL ANALYSIS .
________________________________________________________________________________________________________
These are just theories I am testing out to see what I need to adjust based on results.
Leave me a comment if you see something I need to change, I'd appreciate it.
THIS IS NOT FINANCIAL ADVICE.

DOGE LONGDOGE will be fully integrating to ETH being able to be used for smart contracts! This is huge! It has been tested and did awesome it fully secure and recognized. People are havening their crypto in DOGE right now. MY #1 pick!

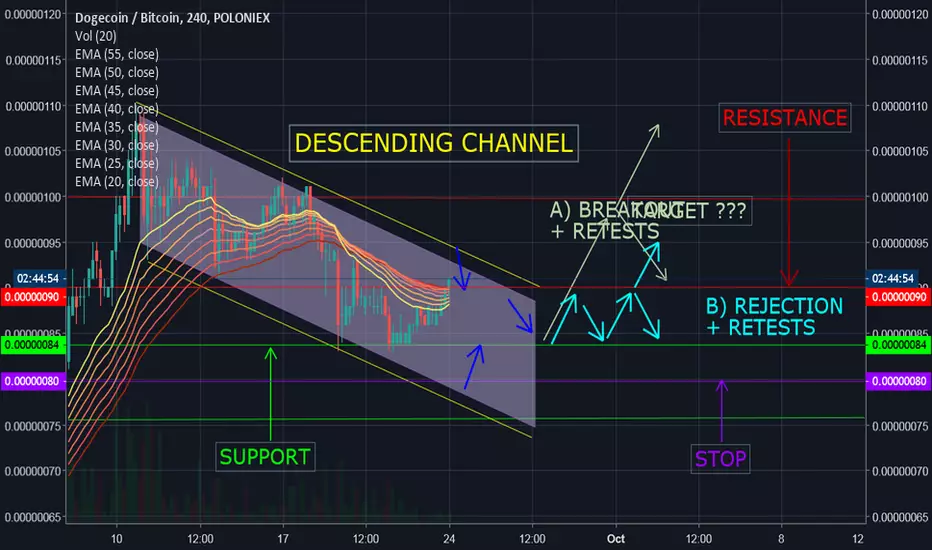
$DOGE- TEST, 1H : # 5 (updated, nothing significant) All blue arrows have been slightly moved to an open area as to not get blocked out by candles to track my logic/prediciton of price action.
Not much going on, S/R levels are the same, still. Will update once I see the need to based on new data. I see more sideways movement in the near-term but will update when I see something HAS to be adjusted.
RSI took a dip and the MACD is showing a signal crossing is likely.
__________________________________________________________________________________________________________________________________
I AM PERSONALLY GOING LONG WITH DOGE BUT WANT TO TRACK/TAKE NOTE OF PRICE MOVEMENT IN DIFFERENT SCENARIOS, MORE THAN ANYTHING ELSE, WHILE LEARNING TO USE THE TOOLBOX AND TECHNICAL ANALYSIS.
__________________________________________________________________________________________________________________________________
These are just theories I am testing out to see what I need to adjust based on results.
THIS IS NOT FINANCIAL ADVICE.
Leave me a comment if you see something I need to change, I'd appreciate it.

And here you are selling your last coins$DOGE is doing fine and people are panicking.
A sea of green will flood the world soon.

$DOGE- TEST, 1H : # 5 (S/R + TARGET P/L updated) I saw some errors on the last chart (TEST #4), S/R levels were not accurate. It will be erased since this is more accurate.
All blue arrows have been left untouched to track my logic/prediciton of the price action.
These are just theories I am testing out to see what I need to adjust based on results.
THIS IS NOT FINANCIAL ADVICE.

$DOGE- TEST, 1H : # 4 (S/R + TARGET P/L updated) Everything else has been left untouched.
These are just theories I am testing out to see what I need to adjust based on results.
THIS IS NOT FINANCIAL ADVICE.

Might be seeing 300+DOGE is being used for intra-exchange capital shifts.
DOGE is a trusted brand (arguable more so than LTC at this point, and pretty much all the recent sh*t coins)
DOGE has historically made millionaires several times (not just a one-and-done coin)
DOGE is up, everything else is down. Why? Because investors are harboring their gains in DOGE, while the alt-coin purge is happening.
1 cent DOGE is probable.
10 cent DOGE is possible.
$1 DOGE is not a crazy thought - the brand cannot be underestimated. People trust this coin. It has been around for longer than almost every top 100 coin. The developer team is well known and respected. It's not going anywhere. It is stable. It is accepted on pretty much every exchange. It is a face of social revolution - the power of meme is not to be underestimated - this is how the 'cool' Crypto people can recognize each other. It's like an inside joke - except this joke makes people millionaires in batches, about 1-2 times per year.
Good luck and trade safe!

Buy now or regret laterNothing to say that has not already been said - all aboard the DOGE rocket - destination 150, 200+ possible