Doge/USD-1 month cash data-Huge bullish moveIt is an update to a previous analysis.
Still, I see a huge bullish movement in Doge. the previous movement was complex corrective movement in the form of WXYXZ
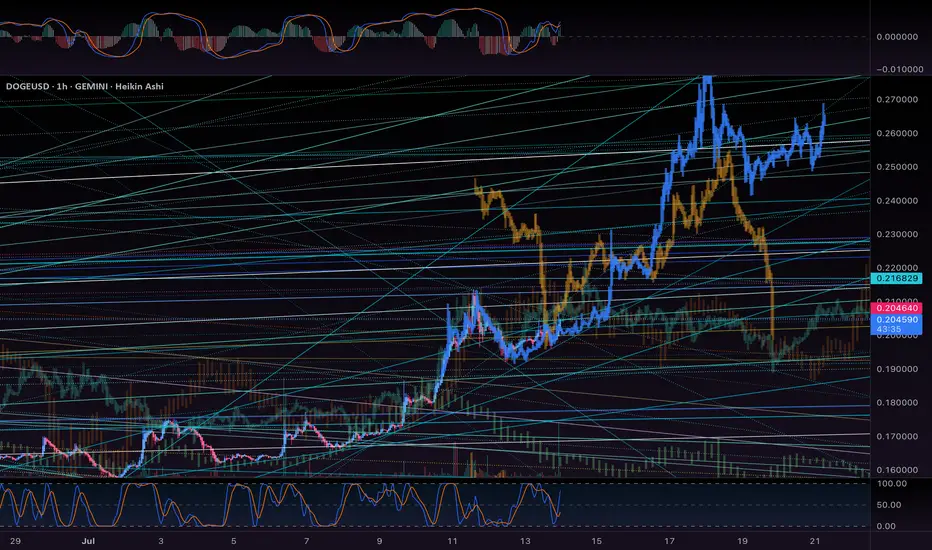
DOGEUSD.P trade ideas

Breakout of a long consolidation- DOGEBeen consolidating been quite some time. Anything above $0.22 and it runs to $0.40 fast.

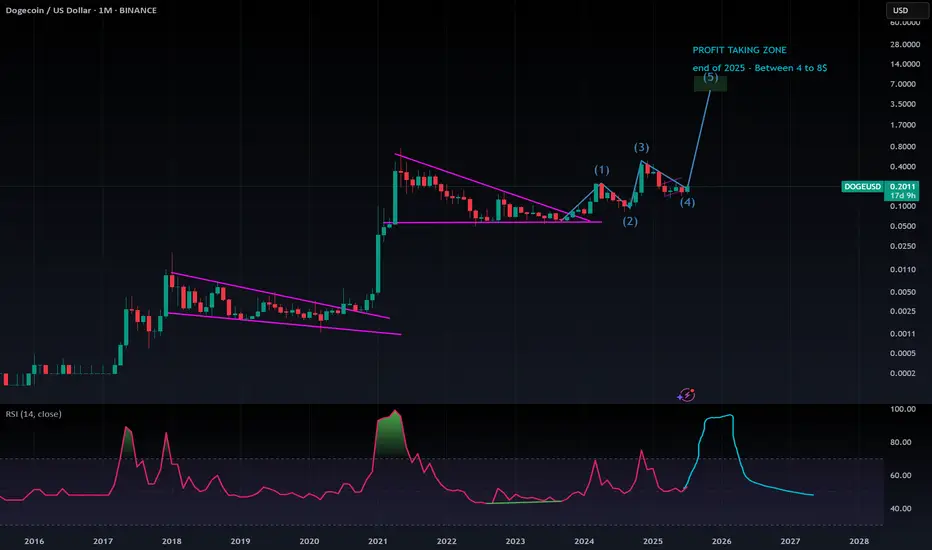
DOGE DOGECOIN DOGEUSDT long/midium term☕ Cup and Handle Forming Again – Targeting $4!
Just like before — we are seeing a massive “Cup and Handle” pattern forming.
Last time, the exact same structure played out, and the price perfectly reached the previous high upon completion of the pattern.
📌 Current Setup
The cup is already formed, and now we are clearly drawing the handle
If history repeats — and it often does in crypto — the price should break out and target above the previous high
🎯 Projected Target:
Based on the structure, the full Cup & Handle breakout points toward a move up to $4.
⚠️ Things to watch
Fakeouts are possible, so use proper risk management
💬 "Patterns don’t repeat exactly — but they often rhyme."
Let the chart guide your plan, not emotions.
DOGE: Time for this Puppy to Run!DOGE currently testing major downtrend resistance that started since December 8, 2024. Waiting for a break + retest, then ready to launch.

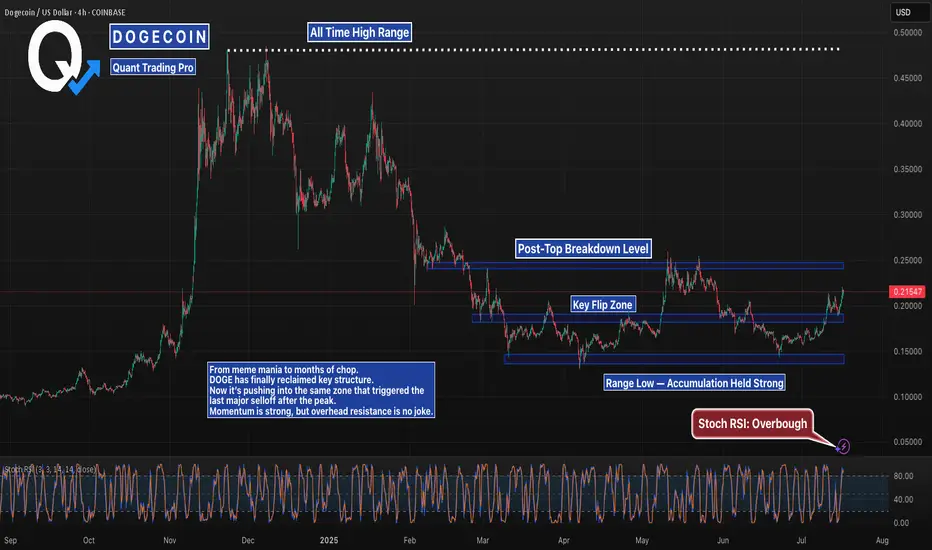
DOGE Is Climbing Back Toward Its Post-Hype BreakdownDOGE peaked near $0.50 during peak hype and crashed hard.
After grinding sideways for months, it’s now reclaiming lost ground.
The $0.245–0.25 zone is where the real test begins — it’s the same area that triggered the major breakdown after the blowoff top.
If bulls hold above $0.20, this push might have real legs.
#Dogecoin #DOGEUSD #CryptoCharts #ChartBreakdown #ResistanceTest #QuantTradingPro #CryptoAnalysis #BacktestEverything #TradingView
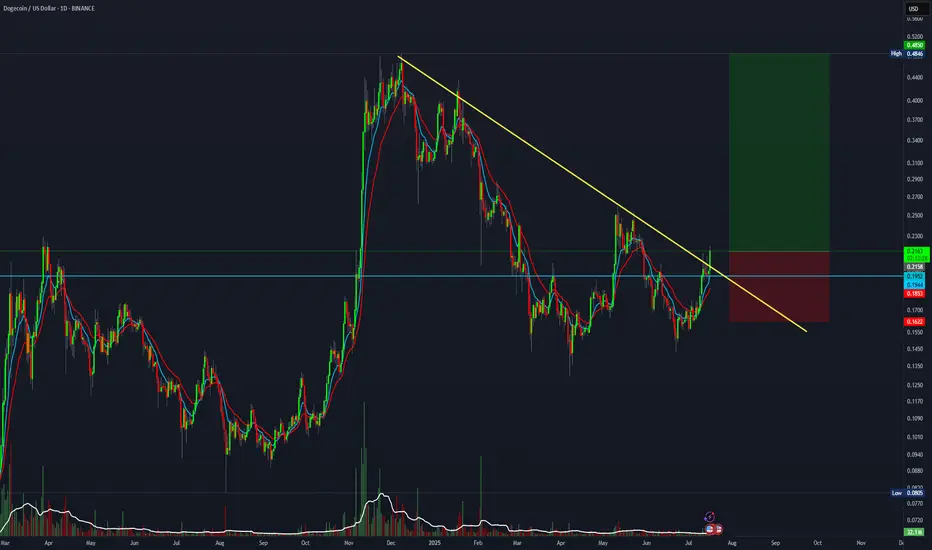
5:1 R:R for Dogecoin.DOGE is breaking out from the trendline. This setup offers a 5:1 R:R
Entry: 0.216
Stop Loss: 0.162
Target: 0.48
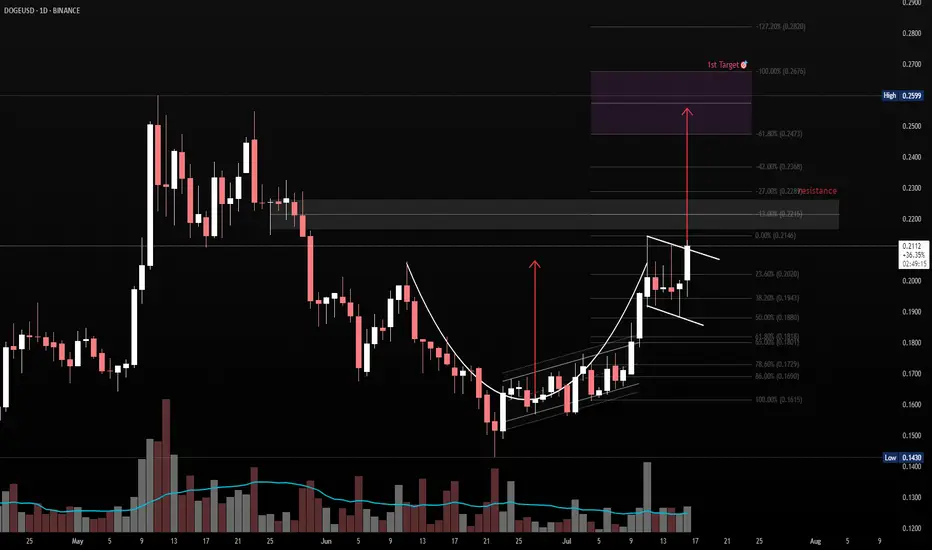
Cup & Handle Breakout Watch – DOGE/USDTPattern: Cup & Handle
Timeframe: 1D
Cup Range: $0.168 → $0.212
Handle: Forming as a descending bull flag
Breakout Level: ~$0.2125
Measured Target: ~$0.256
Confluence:
Clean rounded base (cup)
Tight flag pullback (handle)
Volume decrease during handle = healthy
Prior resistance aligns with projected target zone
Bias: Bullish (on breakout with volume confirmation)
📌 Watching for breakout above handle resistance with rising volume to confirm entry. Measured move aligns with historical supply zone.
After break out from 0.216~0.226
Target Zone: 0.24~0.26
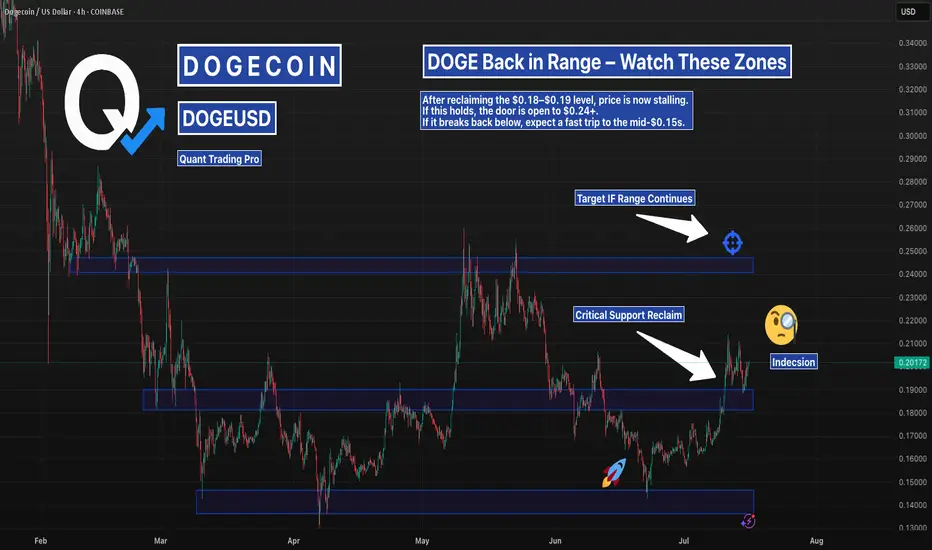
DOGEUSD – Reclaimed Key Support | Range to Continue?DOGE reclaimed the mid-range support zone at $0.18–$0.19 — a previous launch point from early May. Price is now testing this level for confirmation.
If this area holds, the path to $0.24 is back on the table.
Break back inside? Could see a fast drop to $0.15 support.
#DOGEUSD #Dogecoin #Crypto #SupportResistance #QuantTradingPro #TradingView
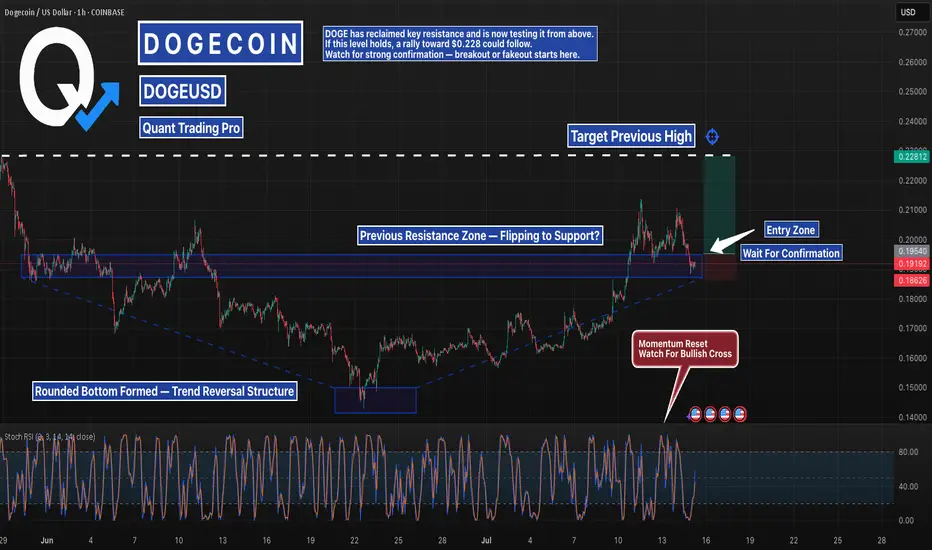
DOGE Retesting the Breakout: Bounce or Breakdown Coming SOON?DOGE has reclaimed key resistance and is now retesting it from above, following a textbook rounded bottom breakout. With Stoch RSI resetting and trend structure still intact, bulls are looking for confirmation before the next move.
If this zone holds, the path toward $0.228 opens up. But without a clean bounce, the setup weakens. Confirmation is everything — don’t front-run the signal.
#DOGEUSD #CryptoTrading #AltcoinSetups #BacktestYourEdge #QuantTradingPro #TradingView #BreakoutRetest
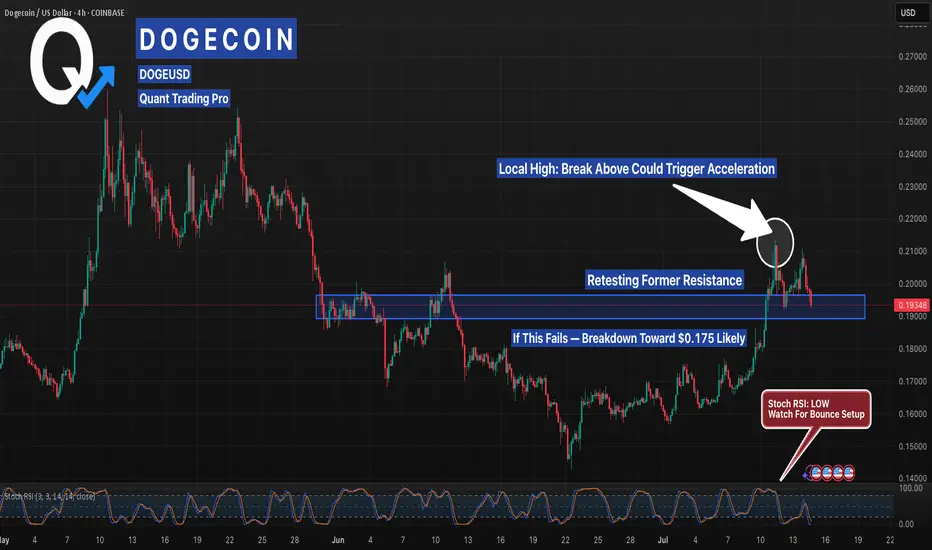
DOGE Just Lost Steam — Retest or Breakdown Loading?Dogecoin’s bullish momentum has stalled after a sharp rally, with price now pulling back into a key former resistance zone near $0.190. This level held firm in June and could act as support — but bulls must defend it fast.
Stoch RSI is nearing oversold, hinting a bounce is possible… but if price loses this level, a full retrace toward $0.175 or lower is on the table. Eyes on the reaction here — confirmation matters more than guessing the bounce.
Wait for strength, not hope.
DOGEUSDMay have some time to take this large move, but at least look pretty good for long-term,
In a very large scale of indicators, they are oversold so lets wait this movement.

DOGE about to reach Plutothis cycle got most of us, offering nothing but two fake altcoin season, with almost full retracement each time.
Enough disgust to move out most altcoin investors.
But what about to come next will only reward the brave !
Get rid of your trauma from the last 24 months with altcoins, sky is the limit now.
DOGE - Running your DOG.These traces represent a few of the prominent behaviors we would expect to see from our beloved DOGe.
As you can see, the orange traces Bearish leg leading into this is fit is much larger than our actual moves… indicating the Bulls are gaining strength. This pattern is matched harmonically to the relevant expansion / contraction patterns, and signature moves. Harmonically… in time. Shifted, in amplitude.
Blue trace is the bull run fractal we would expect to see propagate from the initial moves in this run. As we scale this trace to fit, it gains amplitude, indicating a strong bullish favor, and showing the chorus for an exponential run, as it continues to propagate.
DOGe is famous for its huge runs.
DOGe also assimilates unconditional LOVE… that humans share with DOG’s. Loyalty too…
As such, we expect DOGE to avoid any major corrections or market collapse sell offs. It’s like the emotional safe haven in the games of Fear vs Greed that is all other coins.
Also… check out the longer range analysis linked below. It’s a look at the 2W candle, and the all time chart… 10 years of data!
Let’s Go, Boy!
DOGE Reclaims Key Zone – $0.24 Next or Pullback First?Dogecoin has broken its downtrend and confirmed a reclaim of major support. Now trading inside a decision zone, price could either push toward the $0.24 breakout level or retest $0.18–$0.19 first. Structure remains bullish unless that reclaim fails.
Watch this zone closely — momentum favors bulls, but confirmation is key.

DOGE: Accumulation ???Hello,
DOGE looks to bottom very soon, once the bottom is in with in few days, I expect it to to higher very fast and create a base above $0.25
I'm expecting above .30 with in August as per the charts.
Best to accumulate when the prices are low and take profits when technicals are hit.
happy trading
CAPITALCOM:DOGEUSD

Double bottom at weekly level Time for Doge to finally move up with this double bottom formation. I am Very bullish I believe we will see .47 cents really soon
Not an expert just my opinion.

DOGEUSD: Pumpamentals or Hopium?DOGEUSD is forming a fractal pattern within a broadening triangle. Every Peak there is a descending triangle that follows, and then there is a quick uptrend which breaks above the previous high.
Expect DOGE to hit ATH by EOY if not sooner.


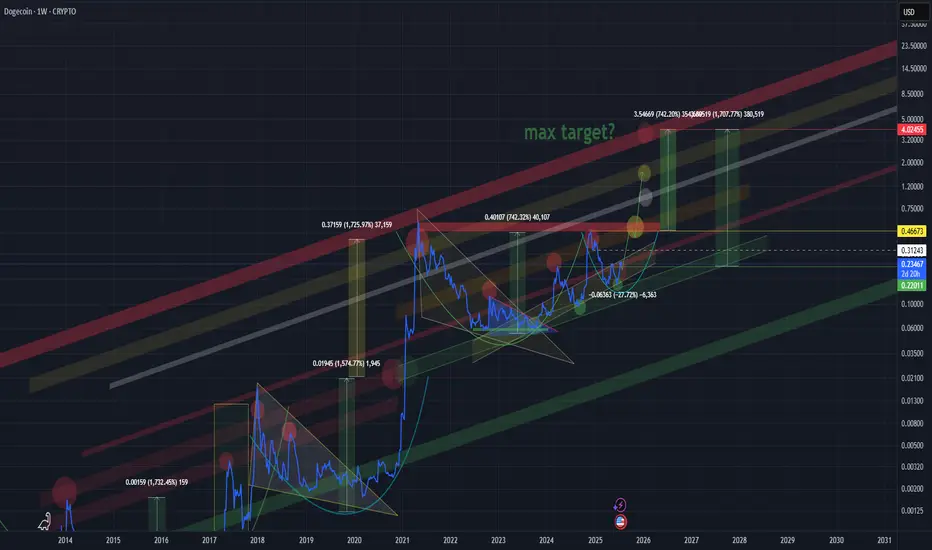
DOGE started its final rally. Don't miss it.Dogecoin (DOGEUSD) has been trading on a Bullish Megaphone pattern within a Channel Up. The recent (June 16 2025) rebound on the 1W MA200 (orange trend-line) is a Higher Low at the bottom of both patterns.
With the 1W RSI also rebounding on its long-term Support Zone, Doge is most likely at the start of the new Bullish Leg, which could be the final rally that will shape this Cycle's Top.
As the previous two Bullish Legs peaked on the 3.618 Fibonacci extension of the last decline, Doge is technically targeting $1.2500. If you (naturally) wish to pursue a Target within the Channel Up though, you can settle for $0.800.
-------------------------------------------------------------------------------
** Please LIKE 👍, FOLLOW ✅, SHARE 🙌 and COMMENT ✍ if you enjoy this idea! Also share your ideas and charts in the comments section below! This is best way to keep it relevant, support us, keep the content here free and allow the idea to reach as many people as possible. **
-------------------------------------------------------------------------------
💸💸💸💸💸💸
👇 👇 👇 👇 👇 👇

$DOGE SCALPI believe we will see a increase in price. Cup and handle forming breaking out of a falling wedge. Looks very promising I will update regarding this one trade is active!

DOGEUSD – Stairway After the SpikeDOGE printed a vertical spike from $0.1600 into $0.1800, followed by a complete fade to $0.1630. It’s now in a slow stair-step recovery, pushing toward $0.1690–$0.1700. If bulls can flip that level, we may see continuation toward $0.1740. Key support sits at $0.1640.

DOGEUSD 4H Chart Analysis - Bullish Breakout in Play!✅ Buy Setup - Retest Opportunity After Breakout
Dogecoin has broken out of the previous resistance area near 0.17000, showing strong bullish momentum. Price has created a clean bullish structure, and buyers are in control.
Buy Zone:
Look for potential entries between 0.17000 - 0.17150 if price retests this zone.
---
📊 Trade Setup Details
Buy Entry: 0.17150 (Wait for bullish rejection confirmation)
Stop Loss (SL): 0.16850 (Below previous structure support)
Take Profit 1 (TP1): 0.17550 (First bullish target)
Take Profit 2 (TP2): 0.18000 (Psychological resistance zone)
---
⚠️ Risk Management Tip
Only enter after bullish confirmation candle at the buy zone.
Maintain risk-reward above 1:2 for optimal trade setup.
Watch for momentum around 0.17550, price may pause or pull back.
---
💡 Market Sentiment
Breakout structure indicates bullish strength.
As long as price holds above 0.17000, bullish continuation expected.
Failure to hold above 0.17000 invalidates this buy setup.
---
#DOGEUSD #Dogecoin #CryptoBreakout #TradingView #BuySetup #CryptoSignals

Dogecoin - This is the key structure!Dogecoin - CRYPTO:DOGEUSD - has to reverse now:
(click chart above to see the in depth analysis👆🏻)
A couple of months ago Dogecoin retested the previous all time high. We have been seeing a harsh correction of about -65% thereafter. However Dogecoin still remains in a bullish market with bullish structure. In order to validate this trend, a reversal must happen now.
Levels to watch: $0.15, $0.5
Keep your long term vision🙏🙏
Philip (BasicTrading)
