Doge is a LaggerHello I am the Cafe Trader.
Today we are looking at DOGE.
Normally I refuse to look at "Meme Coins" but with a 33 Billion Dollar Market cap, I don't think it falls into it's own category.
Doge, like many Crypto, have come alive. If this is one you are looking at, here are the Keys:
Short Term
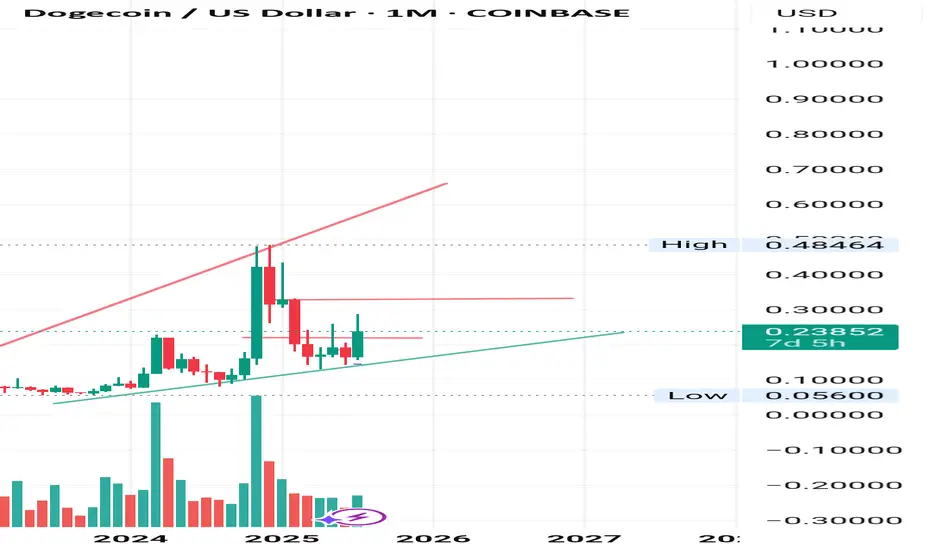
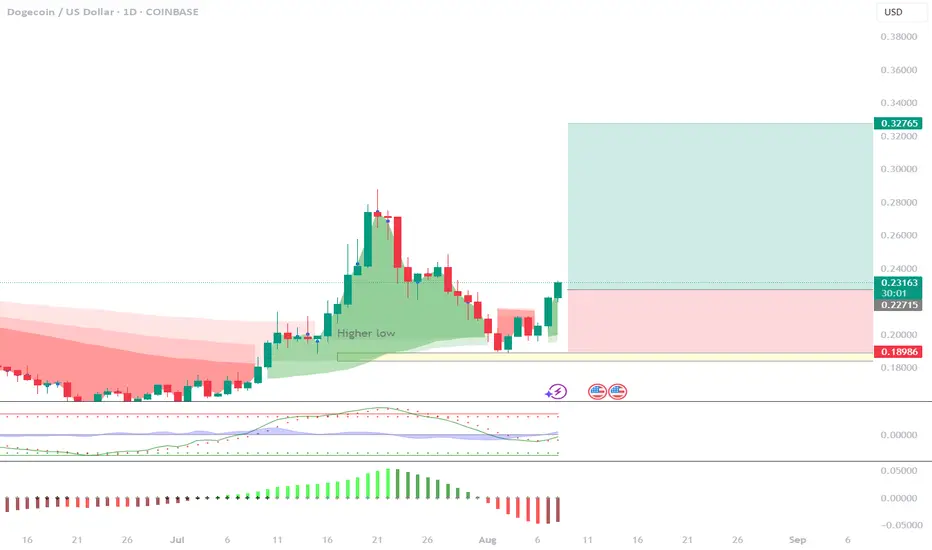
A new seller did prevail as of July 23rd. It's important to note that they are still not in control of this rally. We need to see a key buyer get taken out first. This leads us to the scenario I have drawn.
Green Machine
Big buyers move markets... A lot. They can't buy what they want to buy on the open market without a reaction, so what do they do? Simple
Buy... then wait... then buy again near where they bought before.
So your "Strong buyer" is that area.
You have passive buyers looking to get a good price at 19.223 This would offer the greatest position for a reversal and a continuation.
Long
Entry - .19.250
Stop - .17.050
1st TP .24.050
2nd TP .28.600
Final TP .38.250
This should take at least a month. Be prepared to not look at it everyday.
Long Term
These prices should reflect your sentiment on DOGE.
Aggressive = .20.650
Good Price = .18.900 - 19.250
STEAL = 13.950 - 14.550
Thanks for reading, Don't forget to Boost and Follow !
Happy Trading
@thecafetrader
DOGEUSD trade ideas

Dogecoin - It is all totally expected!🐶Dogecoin ( CRYPTO:DOGEUSD ) will break out soon:
🔎Analysis summary:
Just this month, Dogecoin perfectly retested a significant confluence of support and is starting the expected rejection. With bullish momentum picking up, there is a very high chance that Dogecoin will break the all time high in the near future.
📝Levels to watch:
$0.5
🙏🏻#LONGTERMVISION
SwingTraderPhil

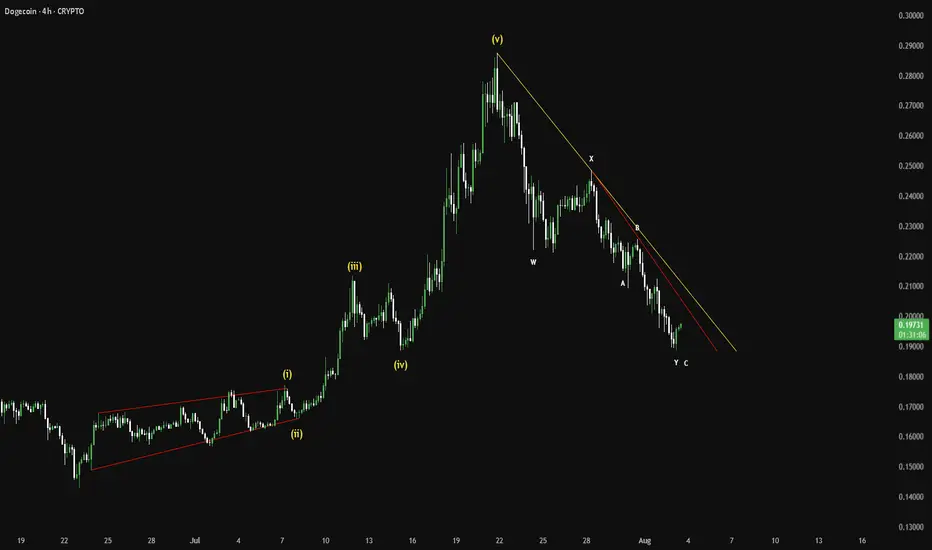
DOGE Breakout?After a 13 day rally and a 12 day pullback, could DOGE be breaking out and confirming a new 4H trading range?
After a bounce off the bullish orderblock DOGE has broken out of the diagonal downtrend, then pulled back to retest the previous diagonal resistance level as new support. This is a textbook breakout play & retest but this doesn't 100% guarantee the breakout will be successful. Should it be a successful breakout Local Resistance is the first clear level of interest for the bears to fight back.
This type of setup does give a clear invalidation should price fall back into the downtrend with acceptance. A fakeout could also lead to a loss of the Major Support level, that would introduce a potential revisit of $0.166.

If BTC does not fall. DOGE has the potential to pump higherHey guys, I think if BTC does not fall. DOGE has the potential to pump 11% or goes to $0.1828
I believe between now and in 12 hours time the 1D chart average mean for the DOGEUSDT price currently is still bullish. The next trading day in 12 hours will decide which, but if BTC and the rest of the top cryptos don't dump, I think DOGE has fallen so deep it has a lot of energy to pump and we are already seeing it. Let's see if we have some continuation, but I am long with a trailing stop of 2% at time of writing

golden thingsHere we have DOGE resting on a trendline in the Fibonacci Golden Zone, and area where price at times pulls back. We also have the possibility of a golden cross occurring, which last time it was very favorable for the bulls. So it seems that the bulls need price to make Higher Highs and Higher Lows from the Fibonacci Golden Zone and maintain the trendline; which could also bring in a successful golden cross. DOGE needs to reclaim the 0.20631 price area the 50 EMA for bullish activity and bears need price to go to the 0.197 price area for hopes of bearish action. Please be careful of fakeouts and consolidations.

DOGEUSD Long Setup – Bounce from Strong Demand ZoneDogecoin is currently showing signs of a potential bullish bounce off a major demand zone (green area between $0.18049 – $0.19795). This zone previously served as a launchpad for the previous rally and is structurally significant for Smart Money participants.
🔑 Key Levels:
🟩 Demand Zone (POI): $0.18049 – $0.19795
🔵 First Resistance (TP1): $0.23329
🔵 Second Resistance (TP2): $0.27070
🔴 Current Price: $0.20494
📌 Smart Money Concept (SMC) Notes:
Break of Structure (BOS): Happened after the bullish rally from this same green zone.
Return to Discount: Price has now retraced into a discount level within the original demand zone.
Liquidity Grab: Sell-side liquidity likely swept from previous lows before showing signs of bullish intent.
🛠️ Trade Plan:
Entry: Inside the green zone upon bullish confirmation
Stop Loss: Below $0.18049 (structure break)
TP1: $0.23329
TP2: $0.27070
🔮 Forecast:
If buyers step in around the demand zone, DOGEUSD may begin a bullish impulse wave, targeting the upper resistance zones and potentially forming a new higher high.
🛑 Disclaimer:
This is not financial advice. For educational purposes only. Use proper risk management.
📎 Hashtags:
#DOGEUSD #Dogecoin #CryptoAnalysis #SmartMoney #PriceAction #OrderBlock #BOS #DemandZone #FrankFx14 #TradingView

DOGEUSD LONG BUYDOGECOIN doing a very good pattern.
I made a ghost pattern of last year and look the same as today.
We are waiting a long position. Lets hope this is just de beginning.

DOGE COIN made a bottom ? start of a new trend ?preferred counts
everything is on the chart , for this dogecoin if not holding then it will move down more

Double Bottom?Is there a double bottom forming on the trendline?
RSI may break the midpoint and reach the 50 levels?
The CCI at this time is hooking up.
Stochastic RSI is currently hooking up and K is 38.02 and D is 28.06.
MACD (Chris Moody) is currently close to turning bullish.
If the golden cross happens the bulls maybe be in for a pleasant surprise.
200 EMA orange
50 EMA blue.
However the bears are nigh and the bulls need to clear 0.23142 for some form of safety.

DOGEUSD Long (+30%)DOGEUSD poised for a breakout! 🚀
Watch for a rise from the $0.181 level within the Order Block zone, aiming for a higher OB zone as the next big target. 🔥

DOGEUSD Bullish Setup – Demand Zone Reversal in PlayDOGE/USD has rebounded from a clearly defined demand zone around $0.18049 – $0.19795, showing signs of strength after forming a higher low. This zone has acted as a historical buy area and is reinforced by strong volume activity.
🔹 Key Levels:
🟠 Demand Zone: $0.18049 – $0.19795 (Confirmed accumulation zone)
🔵 Immediate Resistance: $0.23128
🔵 Major Supply Zone: $0.27346 – $0.28000 (Strong rejection area in past structure)
🟢 Bullish Scenario:
If the current bullish momentum holds:
Target 1: $0.23128 – First structural resistance
Target 2: $0.27346 – Previous high and major supply zone
Green arrows indicate the potential upward move if buyers sustain pressure.
📌 Trade Idea:
Buy Setup
Entry: $0.19800 – $0.20600 (current area)
SL: Below $0.19400 (below demand zone)
TP1: $0.23128
TP2: $0.27346
⚠️ Caution:
If price closes below $0.19400, bullish setup becomes invalid.
Wait for strong bullish confirmation before entry (e.g., bullish engulfing, higher low, or break above $0.21000).
🔁 Follow for more DOGEUSD and altcoin demand zone plays.
📊 #DOGEUSD #Dogecoin #Altcoins #CryptoTrading #DemandZone #PriceAction #TradingView

DOGEUSD – Pressing the RoofDOGE is pressing against the 200 SMA from below, with the price floating at $0.19929 and testing $0.20007 resistance. RSI is holding steady above 54 with a modest positive slope. Reclaiming this zone could trigger intraday momentum.


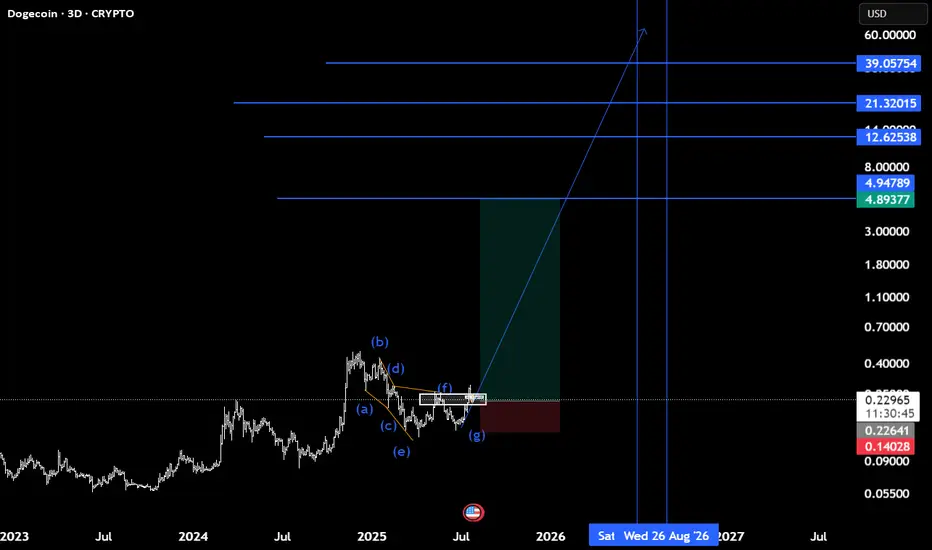
Doge(based on NEo wave)confirmation of finishing the E wave of triangle is here now.
it takes about 400 days for all targets to pass.
see the related last chart of doge.
THE TRUTH ABOUT DOGECOINDogecoin is looking really toppy. As you can see the RSI has peaked out early before a new high which is alarming. I think Doge is in serious trouble here as the meme craze starts to shift into newer memes. If the head and shoulders pattern plays out you're looking at a catastrophic drop down to 2 tenths of a penny. Doge is EXTREMELY overvalued and needs to come back down to earth. Don't forget there is close to 15 million Doge mined per day forever. It appears with the way the RSI peaked and price didn't break the high that Doge has reached a plateau in price even if the market cap continues to go up.
Not financial advice just my opinion.

Double bottom or fake outHopes of double bottom being formed from the 200 EMA(in orange), may evaporate if the 50 EMA(in blue) does not provide adequate support. Bulls need price and momentum to make Higher Highs from 0.23 area while bears want price to drop below 0.20.

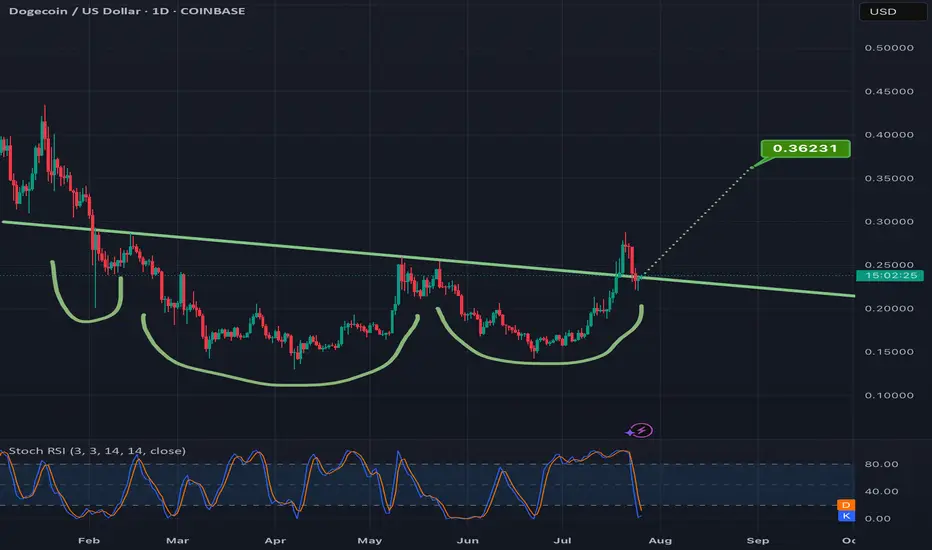
Confirming the breakout of this invh&s on doge can = 50% gainsAlready went above the neckline once and the current daily candle is currently back above the neckline for a second time. Hitting the full target would mean a good 50% gain from current price. *not financial advice*
DOGE LONGCurrent price is over the moving average on the daily chart so Long position is appears to be the best idea
DOGE/USD – Bulls Testing the CeilingDOGE surged above the 200 SMA, topping at $0.2268 before stalling. RSI sits around 53, momentum cooling but still constructive. As long as $0.2210 holds, bulls may reload for another breakout test. Break above $0.2268 could send DOGE into $0.2300+ quickly.
🟢 LONG above $0.2268 – breakout continuation path.
🔴 SHORT if $0.2210 breaks – deeper retrace risk.
📊 Keywords: #DOGEUSD #BreakoutTest #SMAFlip #MemeMomentum #CryptoWatchlist

DOGE 30m – Trendline Break + Bearish Divergence = Clean ReversalThis DOGE 30-minute chart offered a textbook reversal sequence:
Price was riding a clean ascending trendline with support from moving averages and strong bullish structure. But things shifted fast.
We saw:
– A clear MACD bearish divergence (momentum fading as price pushed higher)
– A trendline break and lower high, signaling loss of bullish control
– Former support flipped into resistance, confirming the structure shift
– Price now consolidating near the last major demand zone
If this zone breaks, expect continuation lower. If it holds, this could become a temporary bounce area — but momentum is clearly in the bears’ hands for now.
Zoom out for confluence and track price behavior around this zone for your next move.
#DOGE #CryptoTrading #TechnicalAnalysis #MACD #ReversalSetup #TrendlineBreak #SupportResistance #QuantTradingPro

Doge update I'll be expecting a breakout to 0.33
If we can get past 0.35 I will be expecting a rally quickly.