The key is whether it supports around 0.18951
Hello, traders.
If you "Follow", you can always get new information quickly.
Please also click "Boost".
Have a nice day today.
-------------------------------------
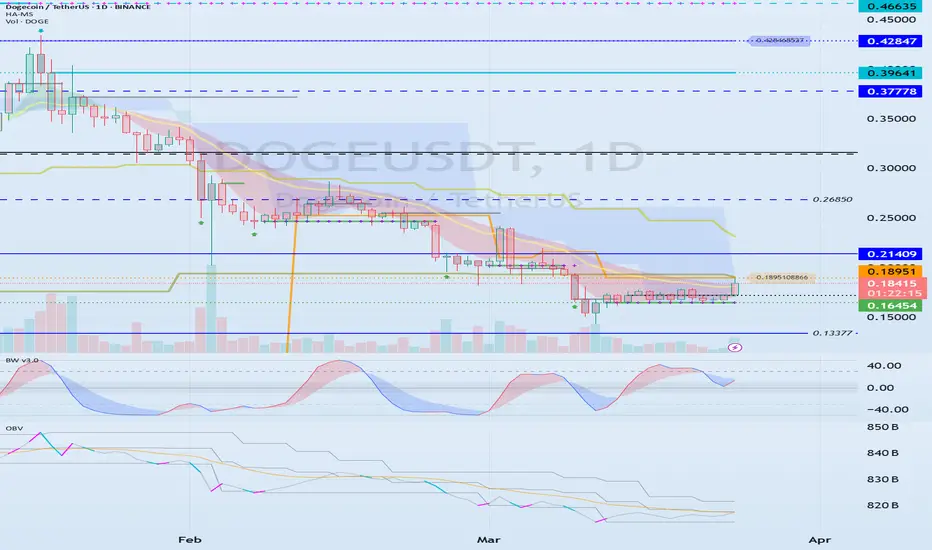
(DOGEUSDT 1D chart)
The key is whether it can maintain the price by rising above 0.18951.
If it rises after receiving support near 0.18951, we need to see whether it can rise above the M-Signal indicator on the 1W chart.
In other words, we need to see whether it can maintain the price above 0.21409.
If not, it is likely to show a downward trend like the previous trend.
-
Therefore, I think this is a great opportunity to turn into an upward trend in line with the flow of BTC.
What we need to do is to check if it is supported around 0.18951.
If it is supported, it is a time to buy.
Since the M-Signal indicator of the 1M chart is passing around 0.18951, it is highly likely that it will show a different flow than before.
Since OBV has to break through the upper line of the Price channel to surge, it is better not to rush too much and check if it is supported around 0.18951 before trading.
-
Thank you for reading to the end.
I hope you have a successful trade.
--------------------------------------------------
- Big picture
I used TradingView's INDEX chart to check the entire range of BTC.
(BTCUSD 12M chart)
Looking at the big picture, it seems to have been following a pattern since 2015.
In other words, it is a pattern that maintains a 3-year bull market and faces a 1-year bear market.
Accordingly, the bull market is expected to continue until 2025.
-
(LOG chart)
Looking at the LOG chart, we can see that the increase is decreasing.
Accordingly, the 46K-48K range is expected to be a very important support and resistance range from a long-term perspective.
Therefore, we do not expect to see prices below 44K-48K in the future.
-
The Fibonacci ratio on the left is the Fibonacci ratio of the uptrend that started in 2015.
That is, the Fibonacci ratio of the first wave of the uptrend.
The Fibonacci ratio on the right is the Fibonacci ratio of the uptrend that started in 2019.
Therefore, this Fibonacci ratio is expected to be used until 2026.
-
No matter what anyone says, the chart has already been created and is already moving.
It is up to you how to view and respond to it.
Since there is no support or resistance point when the ATH is updated, the Fibonacci ratio can be appropriately utilized.
However, although the Fibonacci ratio is useful for chart analysis, it is ambiguous to use it as a support and resistance role.
The reason is that the user must directly select the important selection points required to create the Fibonacci.
Therefore, it can be useful for chart analysis because it is expressed differently depending on how the user specifies the selection point, but it can be seen as ambiguous for use in trading strategies.
1st: 44234.54
2nd: 61383.23
3rd: 89126.41
101875.70-106275.10 (when overshooting)
4th: 134018.28
151166.97-157451.83 (when overshooting)
5th: 178910.15
-----------------
DOGEUSDT.3S trade ideas
DOGEUSDT soon after or before touching 0.10 pump is coming Two major daily supports which are:
A. 0.13$
B. 0.09
are ahead and can soon pump the price and after breaking this descending channel to the upside heavy pump will lead and we are looking for targets like 0.50$.
DISCLAIMER: ((trade based on your own decision))
<<press like👍 if you enjoy💚

DOGE is Waking Up — 200% Potential in Sight! Hello Traders 🐺
In this idea, I want to talk about DOGE, but I’ll keep it short and sweet—because everything is already very clear on the chart!
As you can see, DOGE is forming a falling wedge pattern, which you could also consider as a bull flag, since we’re currently in an uptrend. This falling wedge may simply be a pause before the next leg up! 🔥📈
🟢 Two Bullish Scenarios:
1️⃣ Falling Wedge Target ➜ The top of the wedge
2️⃣ Bull Flag Target ➜ Close to the previous all-time high (~$0.87) 🚀
💡 What Should You Do?
Take 50% profit at the first target (top of the wedge), and hold the rest for the second target—the potential ATH retest.
I hope you enjoyed this quick idea! Don’t forget to like and follow for more updates and support! 🙌🔥
And always remember:
🐺 Discipline is rarely enjoyable, but almost always profitable 🐺
🐺 KIU_COIN 🐺

dogeusdt longi think it can go up....
for swing it can be good
its time to start new wave
what do you think?

Doge Looks Bearish Took previous day's low, and closed bearish. Looking to take previous day's low again.
Previous Day High at: 0.16978
Previous Day Low at: 0.16656

DOGE Falling Wedge DOGE price approaching demand zone. Possible reversal from here or 0.1 support area.
All depends on Bitcoin price direction in the near term.

Looks BearishTook previous day's low, and closed bearish. Looking to take previous day's low again.
Previous Day High at: 0.17156
Previous Day Low at: 0.16464
OKX:DOGEUSDT.P

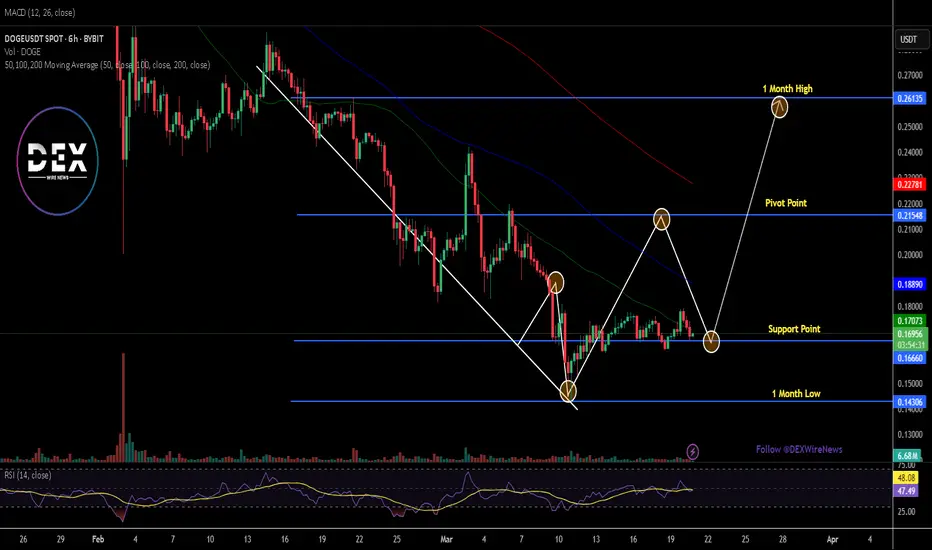
DOGE consolidating between key zones: Is a breakout imminent?The chart shows a strong prior downtrend that has halted and transitioned into a consolidation phase, forming a clear trading range between the marked support and resistance zones, where the lower zone acts as key support preventing further decline, while the upper zone serves as strong resistance limiting upward movement, meaning the price is likely to continue fluctuating within this range until a decisive breakout occurs, with a break above resistance potentially signaling further growth and a drop below support possibly triggering additional declines; however, caution is needed in the event of a breakout due to multiple touches of these zones, as a false breakout could mislead traders and result in a swift price reversal back into the existing range.

DOGEUSDT NEXT MOVESell after bearish candle stick pattern, buy after bullish candle stick pattern....
Best bullish pattern , engulfing candle or green hammer
Best bearish pattern , engulfing candle or red shooting star
NOTE: IF YOU CAN'T SEE ANY OF TOP PATTERN IN THE ZONE DO NOT ENTER
Stop lost before pattern
R/R %1/%3
Trade in 5 Min Timeframe, use signals for scalping

DOGEUSDT near two major daily support zoneAs we can see last and major daily support zones are touching here and soon we can expect range and gain for the price here like the green arrows to the upside.
Major resistances and targets are also mentioned on the chart with red zones too.
DISCLAIMER: ((trade based on your own decision))
<<press like👍 if you enjoy💚

JUST IN: Elon Musk's DOGE Blocks $52 Mln Payment to WEFThe Department Of Government Efficiency (D.O.G.E) a mechanism set up by the President Donald Trump headed by Elon Musk in a shocking news has block $52 million payments intended to be given to the World Economic Forum (WEF). This and many more blockage and unnecessary spendings was tracked and blocked by the DOGE team.
Now, knowing Elon Musk's unwavering support to the altcoin Dogecoin ( CRYPTOCAP:DOGE ) a token that is based on the popular "doge" Internet meme and features a Shiba Inu on its logo, CRYPTOCAP:DOGE coin price is fundamentally tied to The Department Of Government Efficiency (D.O.G.E).
Somehow this mechanism set up by Donald Trump might be the catalyst needed by CRYPTOCAP:DOGE coin to break the psychological $1 resistant with traders eyeing a $1 move this year. As more frivolous spendings and wasting of government funds are unravel, CRYPTOCAP:DOGE coin might be on the verge of a breakout amidst a falling wedge pattern formed since the 2nd week of February, 2025.
Dogecoin Price Live Data
The live Dogecoin price today is $0.169289 USD with a 24-hour trading volume of $1,053,328,921 USD. Dogecoin is down 2.66% in the last 24 hours, with a live market cap of $25,141,281,592 USD. It has a circulating supply of 148,510,656,384 DOGE coins and the max. supply is not available.
Rising Wedge: "Continuation"OKX:DOGEUSDT Analysis – Potential Downtrend Continuation
The bulls initially pushed the price above the rising wedge but failed to hold it as support. As a result, the price retraced, breaking below the trendline once again. The bears not only successfully breached this level but also converted the upper trendline into resistance. Subsequently, within 2 to 3 hours, the price broke below the lower trendline, signaling further bearish momentum.
Traders should be cautious of a potential downtrend continuation. At the $0.161694 level, a large-scale liquidation of approximately $3.01 million is present, making it a potential profit-taking zone if the bears manage to hold the lower trendline as resistance.
This is just my perspective—trade wisely! 🤞⚡💰


DOGE/USDT 1H: Bullish Momentum Holding – Can $0.182 Be ReachedDOGE/USDT 1H: Bullish Momentum Holding – Can $0.182 Be Reached?
🚀 Follow me on TradingView if you respect our charts! 📈 Daily updates!
Current Market Conditions (Confidence: 8/10):
Price at $0.1752, showing strong bullish momentum.
No clear divergences present on RSI, suggesting sustained strength.
Market Maker accumulation visible, confirmed by a recent sweep of lows at $0.163 and strong bounce.
LONG Trade Setup:
Entry: $0.174 - $0.175 zone.
Targets:
T1: $0.178 (initial resistance).
T2: $0.182 (extended liquidity zone).
Stop Loss: $0.171 (below recent support).
Risk Score:
8/10 – Strong risk-to-reward setup with confirmation of Smart Money accumulation.
Market Maker Activity:
Accumulation phase completed with a liquidity sweep below $0.163.
Order blocks at $0.173 - $0.174 indicate continued bullish pressure.
Minimal selling pressure suggests a continuation of the uptrend.
Recommendation:
L
ong positions remain favorable within the $0.174 - $0.175 entry range.
Monitor reaction at $0.178, as a strong breakout could confirm the move to $0.182.
Use tight stops, as pullbacks could occur before continuation.
🚀 Follow me on TradingView if you respect our charts! 📈 Daily updates!

DOGE possible fractal patternBased on past behavior, I'm attempting to extrapolate it to the current situation.
I observe similar characteristics.

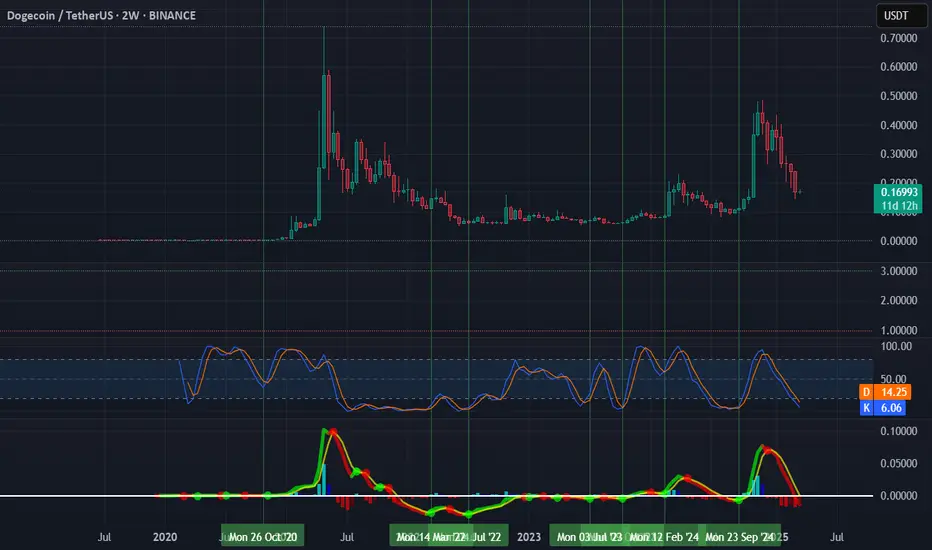
DOGE Coin Chart Analysis on weekly timeframesCRYPTOCAP:DOGE coin at strong Support zone on weekly chart. It look bullish at here.
Target 🎯
1): 0.3$
2): 0.45$
3): 0.6$

Dogecoin - Buy Sell Strategy using 2 week to Buy, 5 day SellBuy signal when 2 week Mac-D and 2 week Stoch RSI have a buy. Set sell when Mac-D 5 day flips to a sell. You can also use 4 day or 3 day to get out faster.
Be careful with DOGE !!!Perhaps this is a cup and handle pattern, and if that's the case, it could push the price up to around 90 cents.
Give me some energy !!
✨We spend hours finding potential opportunities and writing useful ideas, we would be happy if you support us.
Best regards CobraVanguard.💚
_ _ _ _ __ _ _ _ _ _ _ _ _ _ _ _ _ _ _ _ _ _ _ _ _ _ _ _ _ _ _ _
✅Thank you, and for more ideas, hit ❤️Like❤️ and 🌟Follow🌟!
⚠️Things can change...
The markets are always changing and even with all these signals, the market changes tend to be strong and fast!!

DogeDogecoin (DOGE)
Hi guys
### Key Observations:
1. **Price Action:**
- Current price: **0.16358 USDT**.
- Projected price movement indicates a potential upward trend toward **0.42232 USDT**.
2. **Supply and Demand Zones:**
- **Demand Zone (green box):** Indicates areas where buyers might step in, increasing the price.
- **Supply Zone (red box):** Represents areas of potential selling pressure, causing resistance.
3. **Trading Tools & Indicators:**
- Labeled as **FluidTrades - SMC Lite 10 20 2.5**, suggesting a strategy based on Smart Money Concepts (SMC).
- Points of Interest (POI) are highlighted, likely indicating critical levels for price reaction.
4. **Market Sentiment:**
- The terms "BUY" and "SELL" prices suggest a current spread, with the price slightly above the equilibrium level.
This chart provides a detailed framework for predicting Dogecoin's price action, catering primarily to technical traders. The marked zones and projected trend offer clues on potential market behavior. Let me know if you'd like a deeper dive into any of these aspects!

DOGESH DOGEMr Dogesh DOGE has only a small vPoC to the black line and the red boxes are the Major nPoC. It is not a high TF trade, hence you know your ranges!

It's almost the same patternWhen you look at the previous bull run, there was a similar double bottom. This is clearly a bullish sign. Wait for 20 january. Still nfa!

DOGE - Bullish Breakout: Key Levels to WatchDOGE - Bullish Breakout: Key Levels to Watch
DOGE has confirmed another bullish pattern, bouncing back after several unsuccessful setups. The current pattern appears both clear and solid, with a promising price breakout already in motion.
If the price successfully climbs above the 0.1780 level, the likelihood of a swift bullish movement will significantly increase. My focus is on the normal target zones at 0.2110 and 0.2760.
Let’s monitor how this setup develops in the coming days.
You may find more details in the chart!
Thank you and Good Luck!
❤️PS: Please support with a like or comment if you find this analysis useful for your trading day❤️

DOGE Doge coin 24hr potterboxDOGE Doge coin 24hr potterbox. This box goes all the way back to around march of 2024. This lets me know where the coin is at. resistance has now turned in to support. right now Doge coin is sitting right above the 50 percent line or cost basis. .15580 ish. as long as it stays above this line it should continue upward. Maybe tomorrow it will take off. Happy Trading
