3M CLS I KL - OB I Model 2 I Targe 50% CLSHey, Market Warriors, here is another outlook on this instrument
If you’ve been following me, you already know every setup you see is built around a CLS Footprint, a Key Level, Liquidity and a specific execution model.
If you haven't followed me yet, start now.
My trading system is completely mechanical — designed to remove emotions, opinions, and impulsive decisions. No messy diagonal lines. No random drawings. Just clarity, structure, and execution.
🧩 What is CLS?
CLS is real smart money — the combined power of major investment banks and central banks moving over 6.5 trillion dollars a day. Understanding their operations is key to markets.
✅ Understanding the behavior of CLS allows you to position yourself with the giants during the market manipulations — leading to buying lows and selling highs - cleaner entries, clearer exits, and consistent profits.
📍 Model 1
is right after the manipulation of the CLS candle when CIOD occurs, and we are targeting 50% of the CLS range. H4 CLS ranges supported by HTF go straight to the opposing range.
"Adapt what is useful, reject what is useless, and add what is specifically your own."
— David Perk aka Dave FX Hunter ⚔️
👍 Hit like if you find this analysis helpful, and don't hesitate to comment with your opinions, charts or any questions.
DOGEUSDT.P trade ideas

DOGEUSDT major breakout to the upside with at least 2x cookingThis breakout would be huge and it is happening now at least +60% gain is easy target so we put Take profit 1 there with our buy Setup which is 1:3(Risk:Reward).
Hope you all enjoy and it is time for BINANCE:DOGEUSDT to #pump this time and be a leader of MEME for weeks.
DISCLAIMER: ((trade based on your own decision))
<<press like👍 if you enjoy💚
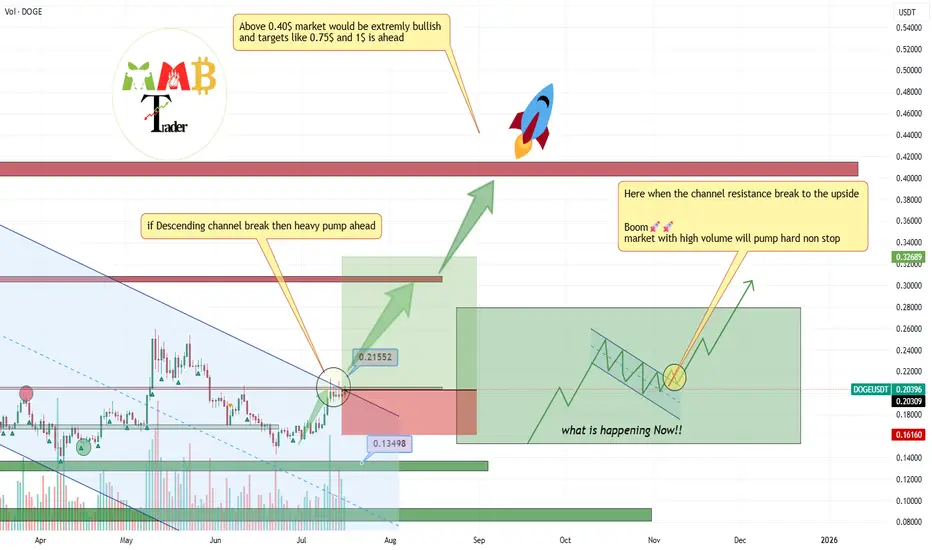
Wooow DOGEUSDT breakout happening Major resistance which is 0.22$ and is also channel resistance is breaking and BINANCE:DOGEUSDT would be nonstop bullish after that at least for a while to the targets like 0.40$ and 0.60$.
As we can see on the chart here is last valid and strong resistance zone after that i am expecting nonstop rise for This token which is still sleep and soon will follow the market and also lead with daily +15% candles.
DISCLAIMER: ((trade based on your own decision))
<<press like👍 if you enjoy💚

DOGE | Gearing up For a BIG MOVEDoge is looking mighty bullish after establishing a clear bottom.
Together with confirmation from BTC, we can safely say that altseason is yet ahead of us. BTC's recent increase show that the bullish impulse is still upon us. And after ETH increases, the rest of the altcoin market will follow suit as per usual.
DOGE is bullish because:
✅ Clear bottom
✅ Higher lows, daily looking to reclaim the moving averages:
✅ Altseason upon us after ETH increase
Ultimately, we need to wait for confirmation - if THIS major resistance zone is cleared (in other words if daily candles close ABOVE this zone) then we're full bull mode.
________________
BINANCE:DOGEUSDT

Portfolio Destruction In Bull Markets = Greed Without Strategy When the market is bullish, everyone thinks whatever they buy will make a profit.
But does a rising price really mean you’re winning? Or are you just chasing an illusion?
What kills most traders is greedy trading without a clear plan even when the market is green!
Hello✌
Spend 3 minutes ⏰ reading this educational material.
🎯 Analytical Insight on Dogecoin :
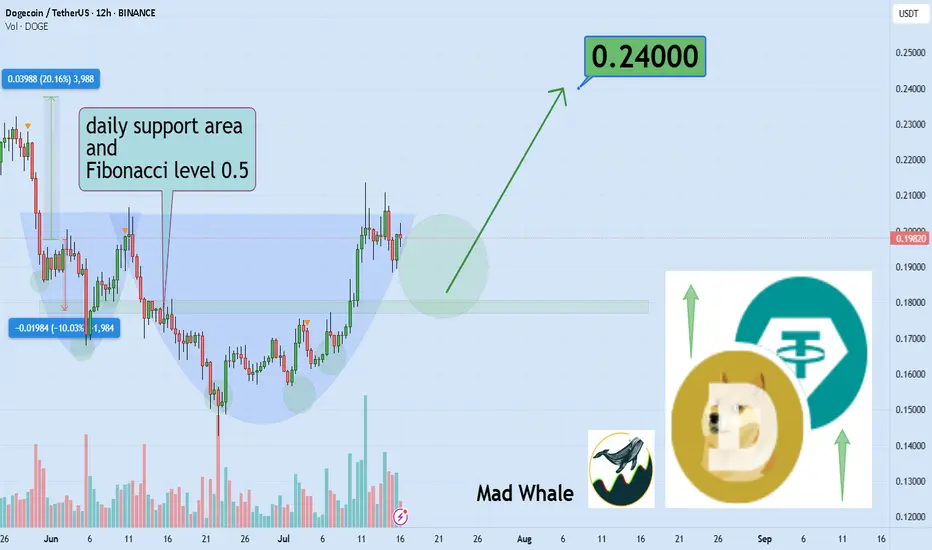
🚀 After breaking out of its daily downtrend channel, BINANCE:DOGEUSDT is now testing a strong support zone near the 0.5 Fibonacci level. This setup suggests the potential for a further 20% upside, with the main target around 0.24.
Now, let's dive into the educational section,
🧨 When the market is green fear should grow
In bearish markets people are cautious But in bull runs everyone fears missing out
This phase is exactly what pumpers love Why Because they know people are ready to chase every green candle
Are you actually profiting or just running after profits
If you do not have a strategy if your exit points are not clear if you do not know when to take profits
You are giving the game away to others
🕳️ Illusion of control traders’ silent enemy
When a few trades go well you think you have got the market figured out But actually the market has you
This sense of control mixed with greed leads to heavy risking skipping stop losses or riding fake pumps to the end
What is the solution Only strategy No influencer hype no social media noise no candle colors.
📊 Smart use of TradingView’s tools:
Many traders decide with emotions not data
But with a few simple TradingView tools you can base your decisions on data not feelings
One of the most practical indicators to spot overbought conditions or excessive greed is the RSI
When RSI goes above seventy it means the market is in a hype phase That is when many blindly jump in
A simple method Add RSI to your favorite crypto chart and check if a pump happened in the overbought zone
Another tool Volume Profile shows you the price levels with the highest trading volume
When price hits an area with very low volume behind it be cautious This could be a fake top
A golden tip Use TradingView Alerts
Instead of constantly staring at charts set alerts for when RSI passes seventy five or price reaches a suspicious zone Then get notified instantly
This way you let data guide you not momentary excitement
And this is exactly where you separate yourself from an unplanned greedy trader
💡 Summary and advice
Trading without strategy whether in bull or bear markets puts your capital at risk sooner or later
You can’t remove greed but you can control it
TradingView tools exist for exactly this reason to help you think before you act
Profit comes from planning not from chasing the next pump
✨ Need a little love!
We pour love into every post your support keeps us inspired! 💛 Don’t be shy, we’d love to hear from you on comments. Big thanks , Mad Whale 🐋
📜Please make sure to do your own research before investing, and review the disclaimer provided at the end of each post.
Dogecoin Prepares 2025 Bullish Wave · New All-Time HighThe last time that Dogecoin produced strong bullish action was November 2024, more than 217 days ago. Before this wave, there was a small period of growth in early 2024 and that's about it, the market was bearish for a long-time after the 2021 all-time high. There is good news though. Dogecoin is preparing for a new major bullish cycle and this cycle is already in place.
Since mid-March 2025 the action has been weak. No growth but no decline either. Between May and June, there were more than 8 weeks of bearish action but Dogecoin's price remains strong within a mid-term higher low. The last three weeks have been green with this week being full green trading at the top of the candle, the market is about to produce a major advance.
If you look back to October 2024, late, you will see small candles then several huge big candles, maximum growth. That's how Crypto tends to operate. One day the market is silent, the next day we are witnessing the strongest ever bullish wave. This is what Dogecoin is getting into right now.
If you look back to early 2021 it is the same. Late March and early April 2021 we have very small candles and then everything changes suddenly and the market produced astonishing growth. We are on the verge of such an event, the 2025 bull market phase and bull run. Get ready and prepare for a new all-time high.
Namaste.

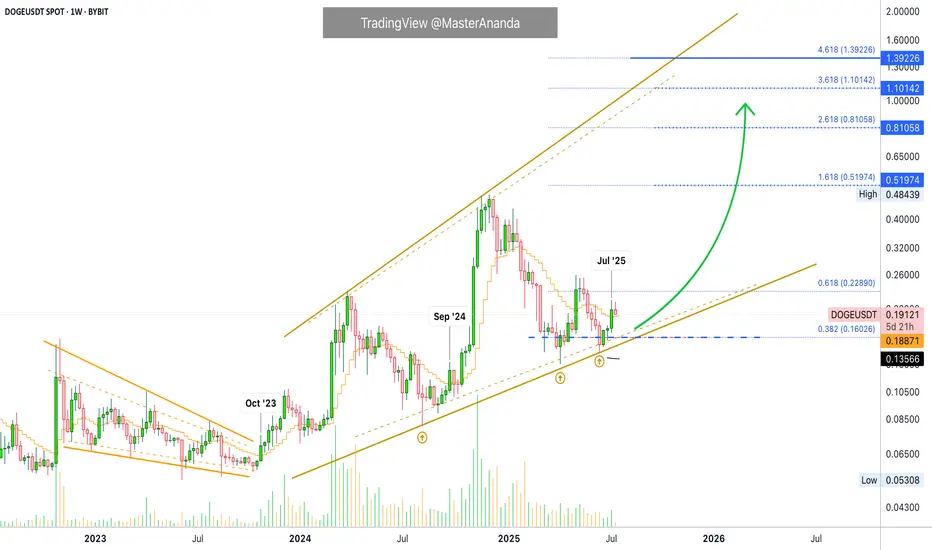
Dogecoin Mid-Term & Long-Term Targets · Advanced Trading TipsNotice here the same price dynamics we just saw with Cardano, the exact same:
» Dogecoin is now on the fourth consecutive green week.
» Dogecoin closed last week above EMA89 on a full green candle.
» Dogecoin is in a rising trend since August 2023 but the market bottom happened in June 2022 rather than 2023. A small variation compared to Cardano but these projects are in the same group, big capitalization, and they tend to move together. What one does, the rest follows.
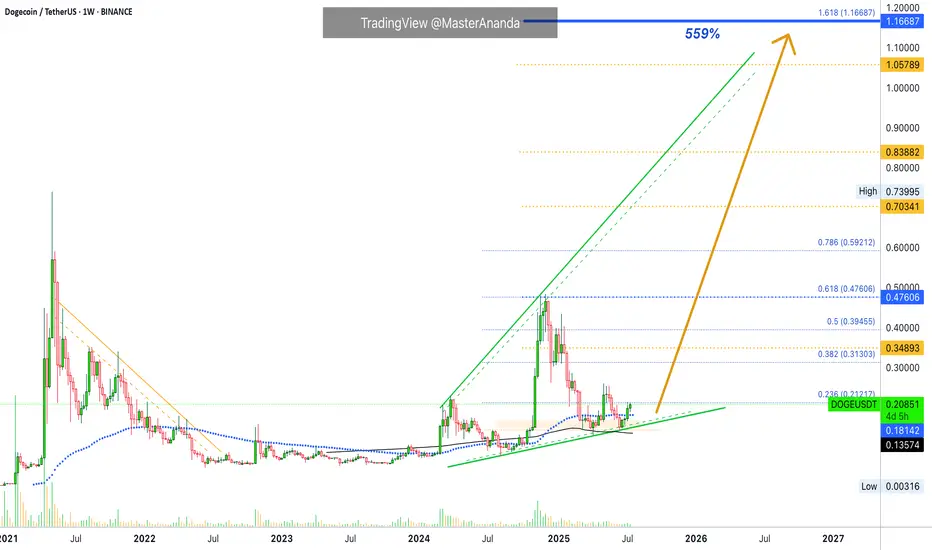
The situation right now is really really good for this pair. Notice that Dogecoin is not only trading above EMA89 but also above MA200. This confirms that we will experience growth long-term.
The yellow targets are the intermediary targets while the blue ones are long-term. The minimum price Dogecoin will reach in this rise is $1.16. This is based on the long-term, the last all-time high, the previous bull market and the broader cycle. Now, it can definitely move much higher but we start with a strong target that has a high probability of success. Depending on how this level is handled, we can aim higher.
For example: I will always be here sharing charts. If at one point the market goes nuts and you need an update, just leave a comment or send me a message and I will look at the chart and share information based on the present day. Market conditions can always change.
Right now we have to make some wild speculations, still educated guesses but as the bull market is more advanced, we will know with a high level of certainty how far up each pair will go. That is because certain pairs tend to move ahead of the pack, look at FUNUSDT as a good example. It has been moving straight up.
An interesting bit of data. 5-May DOGEUSDT produced its last peak. Some altcoins are already trading above their May's high. This simply means that related pairs, those that move in a similar way, will do the same. This signal works as bullish confirmation, it means Dogecoin will continue to grow, with a high level of certainty, we know this based on price action, the chart and marketwide action.
You can use leverage on this setup even now as long as your liquidation is below MA200 to be safe. Very low leverage because it is already moving. If you do higher you are gambling. If you want to gamble that is also ok but we prefer trading: Low risk vs a high potential for reward and high probability chart setups.
The next leg up is already confirmed. We are moving up within days. The bullish action is already happening, it is already live; four consecutive weeks going up/green. Knowing this, we know the 5th, the 6th weeks and so on are composed of major bullish momentum.
Adapt now. Do whatever it takes, whatever you have to do to maximize profits. Opportunities are endless of course.
While it still early for this and many other pairs, there are some that have even less risk, trading at true bottom and the market will continue to have variations for all types of traders.
You can do great in this cycle.
Never take action on an impulse.
If an idea cannot wait a few hours to be implemented or a few days, then just let it go.
A true, valid and valuable idea will be valid even after the initial rush. They tend to come when everything is calm. If you get impulses when excitement is building up, hype and all that, sit, watch and relax, a shakeout can develop. If you feel like going in now hard, then go ahead, right now nobody is excited and nobody is hyped-up, this means that the market is rising and the bullish bias is confirmed. Only when we are approaching a crash everybody will start talking about forever more. When the market is good and low, nobody cares... If you do, you are already an expert.
Namaste.
Check if there is an upward breakout of 0.21409-0.22958
Hello, traders.
If you "Follow", you can always get the latest information quickly.
Have a nice day today.
-------------------------------------
(DOGEUSDT 1D chart)
HA-High and HA-Low indicators are converging.
Accordingly, if it breaks through the 0.21409-0.22958 section, it is expected to surge.
However, since the DOM(60) indicator is formed at the 0.46635 point, we need to look at how the DOM(60) indicator is newly created.
It seems possible that the DOM(60) indicator will be newly created while shaking up and down in the 0.21409-0.31600 section, which is the HA-High indicator ~ DOM(60) indicator section of the 1M chart.
If the DOM(60) indicator is newly created, we need to check whether it is supported in the HA-High ~ DOM(60) section.
If it rises above the HA-High ~ DOM(60) section, it is likely to show a stepwise upward trend.
-
To summarize the above, it is as follows. - Buy range: 0.16343-0.22958
- Resistance range: 0.31600-0.37778
If the price breaks through the resistance range upward and maintains, there is a high possibility that the upward trend will continue in the medium to long term.
-
Thank you for reading to the end.
I hope you have a successful transaction.
--------------------------------------------------
- Here is an explanation of the big picture.
(3-year bull market, 1-year bear market pattern)
I will explain the details again when the bear market starts.
------------------------------------------------------

CUP pattern is completed.The cup pattern is completing. God willing, the price will break out of the depression and see $4.

DOGE's Situation, A Comprehensive Analysis !!!The price on the 3D timeframe is within an ascending triangle, which can be promising. If the price breaks this pattern with bullish candles, it could easily rise by the distance of AB=CD .
Best regards CobraVanguard.💚

DOGE/USDT – Breakout Retest Long SetupDOGE has broken out of local consolidation with momentum and is now retesting the breakout zone, offering a clean long entry with defined invalidation.
Setup Thesis:
After a strong impulse move, price pulled back with low aggression, signaling profit-taking rather than reversal. The current candle structure suggests demand is stepping in at prior resistance-turned-support. This is a textbook breakout-retest continuation setup.
Trade Plan:
Entry: ~$0.1810
Stop Loss: Below ~$0.1764 (beneath breakout zone and structure)
Target: ~$0.1940
R/R: Favorable risk profile with strong reward potential
Confirmation Factors:
Impulsive breakout
Controlled pullback with no aggressive selling
Retest occurring at structural pivot
Still aligned with broader uptrend context
Execution Note:
This setup works best with strong follow-through in the next couple of candles. If price stalls or closes below the stop zone, it's invalidated.

yesascending nicely through the top of the range. Critical resistance at 24 cents. Next is 32 cents.

The Meme Coin Race Has Begun, DOGE fighting for top spot!📈 The Meme Coin Race Has Begun
🔥 The battle for the throne is heating up...
🐶 DOGE, the original meme coin, isn’t giving up its crown without a fight.
Fractals from the past seem to echo in today's chart – history doesn’t repeat, but it rhymes.
⚔️ With new challengers lining up in the meme arena, one question remains:
Can DOGE reach $2.45 and reclaim the top spot?
🚀 Volume is rising. Patterns are aligning.
The king is awake.
👑 The OG vs the New School. Who will win the meme war?
Comment your prediction 👇
#DOGE #MemeSeason #CryptoFractals #Altseason #DOGEUSDT #CryptoTrading #TradingView #FractalAnalysis #CryptoWar #MemeCoins

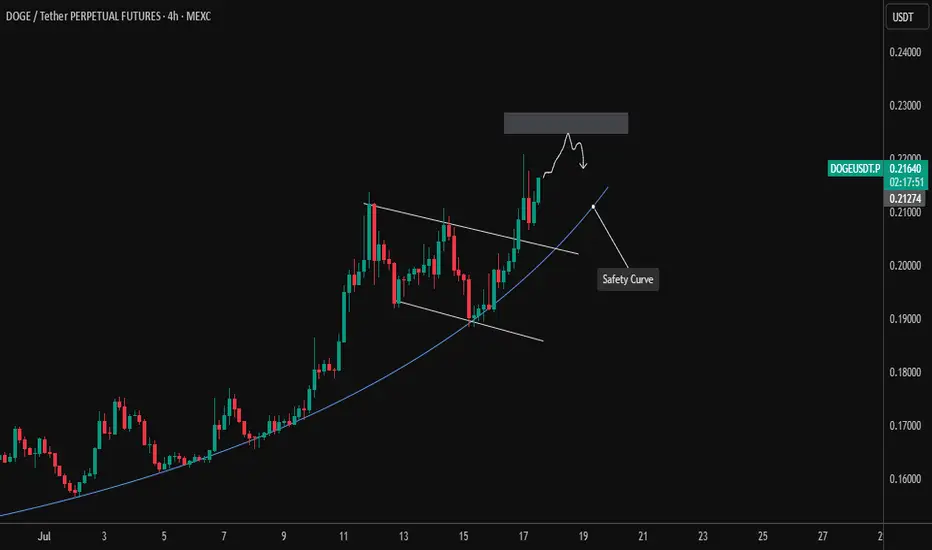
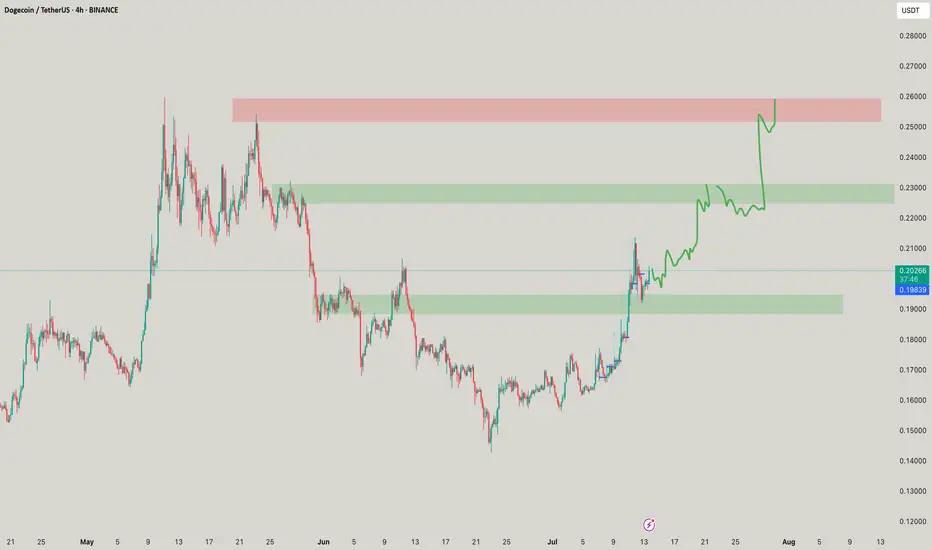
DOGE/USDT – 4H Chart Analysis (July 17, 2025)Dogecoin has been riding a strong uptrend, maintaining its momentum along a parabolic safety curve, which has been respected multiple times.
📈 Recently, DOGE broke out of a descending channel and is now approaching a resistance zone around $0.225–$0.230. This area previously acted as a supply zone, and price action suggests a short-term rejection could be forming.
🟦 Key Observations:
Parabolic trendline acting as a "safety curve" support.
Price approaching a supply zone with signs of slowing momentum.
Potential short-term double top or lower high forming.
📌 Scenarios to Watch:
Pullback from resistance → Retest of the safety curve (~$0.21) = potential long setup.
Break and hold above $0.230 = bullish continuation, targeting new local highs.
⚠️ Risk Management: Enter on confirmation; don't chase green candles near supply. A breakdown of the safety curve may lead to deeper correction.
#Dogecoin #DOGEUSDT #Crypto #TechnicalAnalysis #Altcoins #MEXC
Dogecoin Will Shock Investors With Its Next Move!Today I’m doing an in-depth analysis of Dogecoin and its market cycle in comparison to the early Bitcoin cycles. As you can see, the same human psychology and emotions are playing out in the Dogecoin market that we previously saw with Bitcoin. With mass adoption coming to the cryptocurrency markets, it’s very possible we’ll see a parabolic run on Dogecoin similar to what we saw with Bitcoin in 2016 and 2017. This could lead us to a new all-time high.
Because markets are fractal in nature, we see similar patterns appearing over and over again. If you can learn to understand and identify these cycles and patterns, you can position yourself for maximum profit. I see Dogecoin running very bullish through the rest of 2025, and it could also continue into 2026 as mass adoption drives increasing demand for cryptocurrencies. In fact, we could see the entire crypto market run all the way into 2029, as the stock market is also primed for a large parabolic move in its own cycle.
Stocks and crypto are heavily correlated since both are tied to the global economy. Contrary to popular belief, the world economy may actually be set up for a massive run in value—almost like a “Roaring 20s 2.0.” This means buying Dogecoin today could be like buying Bitcoin in early 2016—the opportunity for profit is enormous.
As always, stay profitable.
- Dalin Anderson

Dogecoin's Bullish Wave Over? Higher High Beyond $1.11111Nope, it is only getting started... Do you see that tiny speck of a black line on the chart? Way below the current candles around 0.135. That's MA200 weekly. Dogecoin is on the bullish zone 100% already confirmed. The bullish wave is only getting started.
DOGEUSDT is trading weekly above EMA13. Watch what happened in September 2024 when Dogecoin broke above this level. Or further back, October 2023. Both instances, there was a bullish impulse; both instances, a higher high.
Dogecoin moved and closed above EMA13 last week, July 2025. Guess what will happen next? A new bullish impulse and a strong higher high.
Patience is key, the market is set to continue growing long-term. No, the uptrend is not over, it is only getting started.
Thanks a lot for your continued support.
Namaste.
DOGE! _ RISK it ! Get itSince ages! Ive never seen such beautiful movement of charts and so is doge, lots of liquidity to get captured! Hopefully it gets done as I marked!

DOGE–USDT: Consolidation in Play, Eyes on Next Big Breakout 🐶🚀 DOGE–USDT: Consolidation in Play, Eyes on Next Big Breakout 📊✨
DOGE has been riding a powerful channel, recently tagging the upper channel resistance around $0.254 before consolidating. Here's the current roadmap:
🔎 Key Levels & Structure
Upper Channel Resistance: Approx. $0.254
Intermediate Resistance: $0.2466
✅ Support Zone to Watch: $0.2166
🔽 Deeper Support: $0.1843
Until DOGE decisively breaks channel resistance at $0.254, we expect a period of choppy action within the funnel. That’s where planning entries and exits matters most.
🎯 Breakout Targets
A clean breakout above $0.254–0.2466 with volume could trigger a new leg.
A fresh high-target projection lands around $0.32, with even higher potential if momentum rockets.
Remember: structure always guides — from support → breakout → next peak.
🧠 Educational Takeaway
We're trading based on the levels, not hoping for a miracle.
Enter near the channel floor, manage risk between support levels.
Wait for confirmation at resistance breakout — momentum is your friend.
This disciplined, technical approach is what separates real traders from dreamers.
One Love,
The FXPROFESSOR 💙
Disclosure:
I am happy to be part of the Trade Nation's Influencer program and receive a monthly fee for using their TradingView charts in my analysis. Awesome broker, where the trader really comes first! 🌟🤝📈
“Technical analysis? Yeah… even Doge respects the lines.” 📈
— Elon Musk, probably 🐶🚀
Elon’s take (my dog) : “Technical analysis? Yeah… even Doge respects the lines.”
It’s a cheeky way to remind everyone: success isn’t luck. It’s levels. Discipline. Watching the structure. 📊
Next steps:
🟢 Aim for $0.254 breakout — momentum could push us towards $0.32+
🟡 Manage risk around support zones — respect them, or be caught offside
This isn’t just meme money — it’s structured momentum. For traders, that matters more than hype.
One Love,
The FXPROFESSOR 💙

DOGE/USDT | Cup and Handle Breakout Setup – Swing Trade IdeaThis is my first post here, and I'm truly excited to begin this journey of learning, sharing, and growing as a trader with all of you.
📈 I'm currently tracking DOGE/USDT and noticed what looks like a classic Cup & Handle formation developing on the 4H chart. I've marked out the structure, potential breakout zone, and my own thoughts on the setup (entry, SL, and TP).
I'm sharing this not as financial advice but as part of my learning and analysis process, and I wholeheartedly welcome your feedback, thoughts, or alternate views — this is how we all get better together. 🙏
🧠 Trade Idea – Cup & Handle Breakout on 4H Chart
I'm observing a clean Cup and Handle pattern forming on the DOGE/USDT 4H timeframe.
Cup formation is smooth with rounded structure
Handle completed with a slight consolidation/pullback
Price is now testing the breakout zone between $0.207–$0.214
A confirmed breakout and candle close above these levels could open the door for a strong move toward TP near $0.246
📌 Trade Plan
Entry Zone: Above $0.2145 (confirmation breakout)
Stop Loss: Below $0.1924
Take Profit (TP): Around $0.2468
Risk/Reward: Roughly 1:2.5 depending on exact entry
⚠️ Disclaimer:
This is not financial advice. Please do your own research (DYOR) before making any decisions. Markets are unpredictable, and this post reflects just an idea and my personal analysis — it could work out or completely fail. Manage your risk wisely!
Let’s keep the community friendly, helpful, and focused on growing our collective trading knowledge. 💬📚
Wishing you all green candles and strong confirmations!
– Cheers, and happy trading! 🚀🔥

Dogecoin Daily, A Closer View · Next Target, How To Trade & MoreYesterday Dogecoin moved above EMA89, a major long-term moving average. Definitely bullish confirmed. We are giving Dogecoin a closer look because the other chart was based on the long long-term, the weekly timeframe. With this one, we will know exactly what happens next.
Today, DOGEUSDT is moving above EMA233 and this one is super long-term. Immediate resistance is found at 0.21300 but this is likely to break right away, always allowing for a few days of fluctuation because the market never moves straight down nor straight up. It fluctuates creating waves.
The next target after this one is 0.26500 followed by 0.34900. These can be hit short-term. In the coming weeks and days. After this one, we will aim at the last high which happened December 2024, now already a long-time ago.
The altcoins market is bullish but this bullishness is very early, it is only getting started. The market will be bullish for such a prolonged period of time that you will get used to seeing bullish action and at one point will become comfortable seeing your profits grow. When this happens, stay alert and make sure to secure some wins on the way up.
Do not chase rising pairs, buy those trading near support. Buy and hold.
This is the best strategy for maximum profits. Also, if you catch a winner, let it ride long-term. This also produces bigger profits in the end vs selling and trying to catch the retrace to buy again. It is better to buy big when prices are low and hold long-term. Only secure some profits when you are really high up, after 2-3 months. And of course, when the time for the new all-time highs is close, that's the time to close all positions.
Thanks a lot for your continued support.
Namaste.

DOGE to the RESCUE!I know most have got liquidated but domge is to the rescue! The red box is the final target one can get it and to be precise can hit the targets as stipulated!
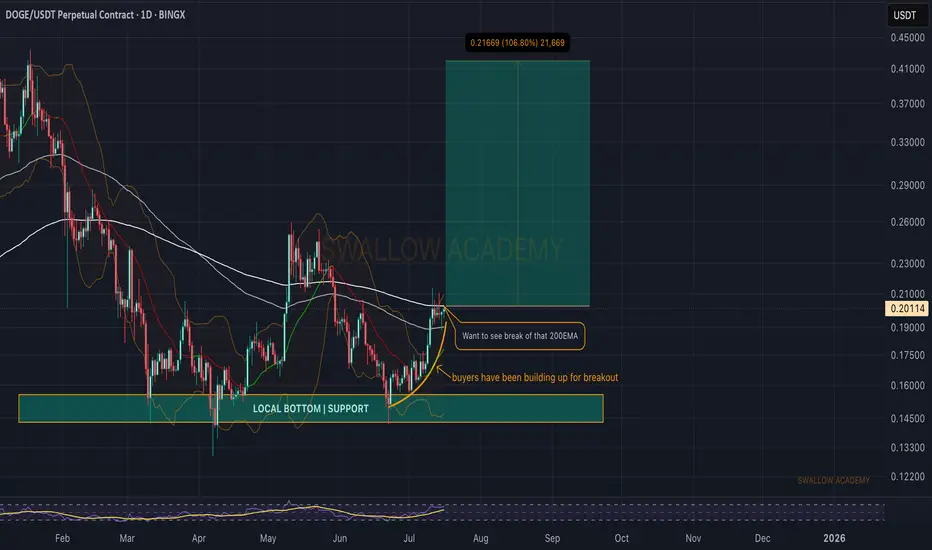
Dogecoin (DOGE): About To Breakout and Start Strong Bullish MoveDogecoin has been on our radars for quite some time, and we had a nice bounce since last time (from the local bottom).
Now we are approaching the breakout point (200 EMA) area, where upon seeing the break we should start a strong upward movement.
Swallow Academy
#DOGEUSDT: Swing Move In Making! Get ReadyThe cryptocurrency market is currently experiencing a rally due to the bullish trend of the underlying assets. The price has experienced a period of accumulation, followed by a distribution process. We have established a swing target based on the potential for the price to reach the previous record high. Technical indicators support our analysis, but we acknowledge the need for strong fundamental support to achieve this level.
We wish you the best of luck in your trading endeavours and encourage you to share our insights by liking and commenting on this post.
Sincerely,
Team Setupsfx_
