Dogecoin: Should I Sell Everything Before The Crash?I want your attention focused on the (3).
On the chart, left side, (1) and (2) is a sequence of low and lower low. (3) is a higher low.
On the right side of the chart, (1) and (2) is a sequence of low and lower low. (3) is a higher low.
On the left , after (3) there was a massive bullish wave.
On the right, (3) will lead to a very strong bullish cycle and phase. The strongest growth period since the 2021 bull market.
Should I sell everything before the crash?
Panic buy. Buy like it is the end of the world.
Buy more, buy and hold while focusing on the long-term.
Never use a stop-loss. Remove any stop-loss orders now and if prices drop, make sure to buy as much as you can because Dogecoin is about to grow really strong in the coming days.
Retraces are an opportunity to buy-up and reload. If you can't buy more, just hold.
No selling at this point. Only sell when prices are hitting new highs. This is the perfect time to buy and hold!
Namaste.
DOGEUSDT.P trade ideas

This is how to read the chart using Weis Wave with Speed IndexReading the chart:
1. We have bottom down and we pull back with high up volume waves, approaching the Fib area. Notice how SI is increasing on the up waves as we are reaching Fib from 13.3 to 15.7 to 18.4 and last not able to break previous resistance at 20.4. This means sellers are absorbing all buy orders of people entering long thinking that the trend will continue.
2. Notice the up volume wave with SI 20.4 and respective pip move right above it which is small compared to the amount of volume used - This is absorption.
3. The highest PVR bar at the beginning of the down wave - more sellers
4. Entry Short on the Plutus Short signal
Notice all the Short signals following confirming the continuation of the down move!
Simple as that, if you are able to read the chart and not just following signals from an indicator.
Enjoy!

DOGEUSDT Ready for Pump(Soon again above 0.25$)We are looking for breakout to the upside and pump which hit targets like +20% -- +50% asap.
Price broke the major daily resistance like red trendline and now is getting ready for next phase pump this time hit targets like 0.25$ after more range here.
DISCLAIMER: ((trade based on your own decision))
<<press like👍 if you enjoy💚

Long trade
15 TF overview
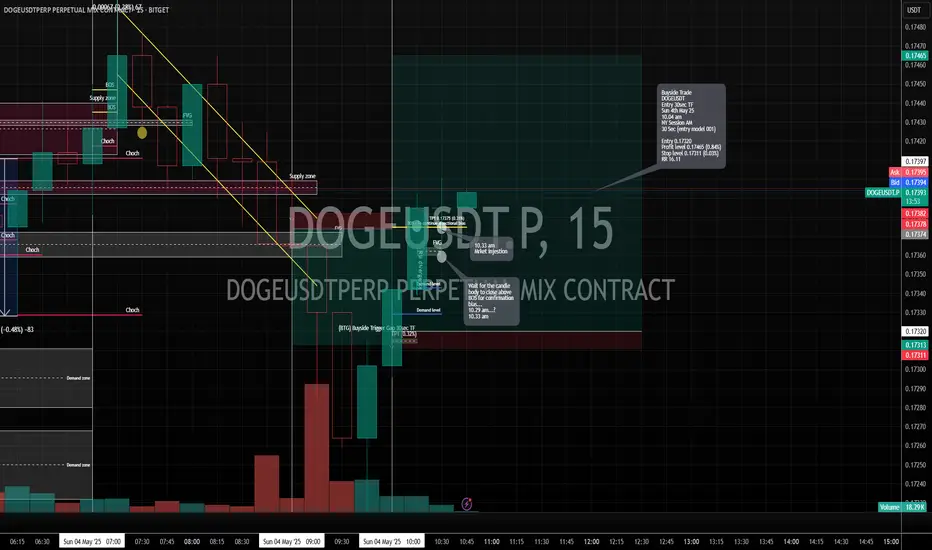
📘 Trade Journal Entry — DOGEUSDT (Buy Side)
🗓 Date: Sunday, 4th May 2025
⏰ Time: 10:04 AM
📍 Session: New York AM
⏱ Timeframe: 30-second chart
🪙 Pair: DOGE/USDT
📈 Direction: Long (Buy Side)
🎯 Entry Model: 001
🔹 Entry Details:
Entry Price: 0.17320
Take Profit: 0.17465 (+0.84%)
Stop Loss: 0.17311 (−0.03%)
Risk-Reward Ratio: 16.11
🔹 Trade Context:
Precision microstructure entry on the 30-second timeframe, aligned with entry model 001
Executed during the NY to LND transition when momentum builds and early positioning unfolds.
30sec TF observation
Short trade
15min TF overview
🔹 Trade Context:
📘 Trade Journal Entry — DOGEUSDT (Sell Side)
🗓 Date: Sunday, 4th May 2025
⏰ Time: 5:00 AM
📍 Session: Tokyo AM
🪙 Pair: DOGE/USDT
📉 Direction: Short (Sell Side)
🔹 Entry Details:
Entry Price: 0.17411
Take Profit: 0.17311 (−0.57%)
Stop Loss: 0.17445 (+0.20%)
Risk-Reward Ratio: 2.94
🔹 Trade Context:
A quick scalp opportunity, targeting a reaction from the local resistance zone. Executed during the Tokyo AM session, where liquidity often thins and price becomes vulnerable to stop runs and engineered sweeps.

DOGE WAKES UP?! The Dog Is Stretching… and It’s Not Just a Meme🐶💥 DOGE WAKES UP?! The Dog Is Stretching… and It’s Not Just a Meme Anymore 🐕🚀
BINANCE:DOGEUSDT – Daily Chart Breakdown
The dog has been sleeping… but every time it twitches, the market barks.
Now, Dogecoin is showing major RSI divergence + volume uptick — and that usually means one thing:
something’s coming 🧠📈
🧩 Technical Signals:
✅ Bullish RSI Divergence (momentum building while price dips)
✅ MACD Flipping Green
✅ Bouncing off long-term trendline support
🚀 Cup & Handle? Or Launchpad to $0.20?
Resistance to watch: $0.155
Breakout zone: $0.168
👁 Watchlist It. Chart It. Respect It.
You don’t want to be the last one to see the breakout candle.
“They laugh at Doge... until it moons again.” – Ancient Crypto Proverb 🌕
📢 Follow for more alpha and try the rsi_Miguel indicator to catch these setups early!
#DOGE #Dogecoin #CryptoCharts #Breakout #MemeCoinMagic #TradingView #RSIDivergence #ShibesAssemble


DOGECOIN BUY LIMIT...Hello friends✌
Given the good price growth and the arrival of buyers, now that the price is correcting, it is the best time to buy.
🙏If you like it, support it with a ✔like✔ and ✔comment✔.
*Trade safely with us*

Long trade
15min TF overview
🗓 Date: Saturday, 3rd May 2025
⏰ Time: 4:30 AM
🪙 Pair: DOGE/USDT
📈 Direction: Long (Buy Side)
🔹 Entry Details:
Entry Price: 0.17912
Take Profit: 0.17998
Stop Loss: 0.17901
Risk-Reward Ratio: 7.82
🔹 Trade Context:
Chart Timeframe: 15-Minute
Key Observations: Price filled a 1-minute Fair Value Gap (FVG) before moving up.
Trade positioned just above a key demand zone / FVG confluence.
The target is aligned near the prior session liquidity area.
1min TF entry

Dogeusdt is in Reversal Pattern Dogeusdt is showing reversal pattern on daily chart the RSI is showing bullish divergence and when the price will break the .206 level it will be a positive sign for bullish sentiment and it will go to test the daily trend line and after closing positive above the trend line it will likely to go in bullish trend again

Doge to 3 and above I'm not going to write much about it. Doge coin price will be around 3 to 4.5 USD before mid 2027 and here's the curve I've drawn.
Let's wait and see what happens.

Can we be optimistic that this will come true?( road to $1 )Perhaps this is a cup and handle pattern, and if that's the case, it could push the price up to around 90 cents.
Give me some energy !!
✨We spend hours finding potential opportunities and writing useful ideas, we would be happy if you support us.
Best regards CobraVanguard.💚
_ _ _ _ __ _ _ _ _ _ _ _ _ _ _ _ _ _ _ _ _ _ _ _ _ _ _ _ _ _ _ _
✅Thank you, and for more ideas, hit ❤️Like❤️ and 🌟Follow🌟!
⚠️Things can change...
The markets are always changing and even with all these signals, the market changes tend to be strong and fast!!

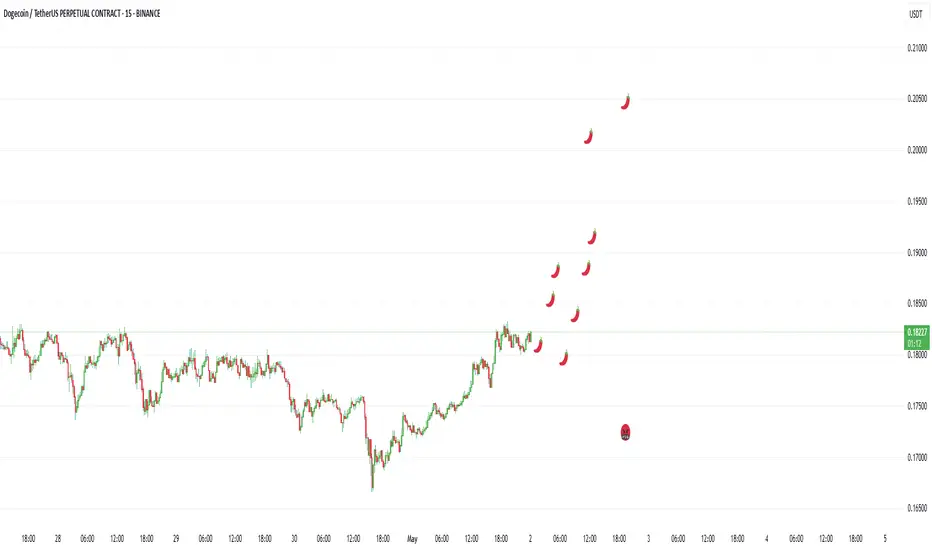
Doge chilliDoge chili peppers chart.
Try to connect as many as you can before it drops to the red face, if it ever does.
Who knows.

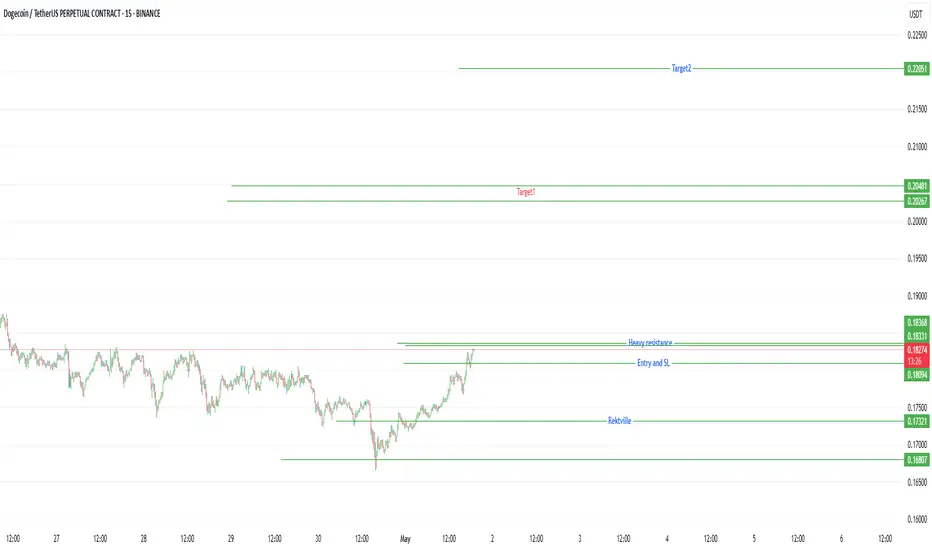
Doge chartDoge chart.
Key levels of support and resistance.
You want the price to stay above heavy resistance and use that as support before going bullish.
DOGE BUY SETUPCurrently on this Doge buy.
Monthly, weekly and daily are all bullish.
Plus BTC is also very bullish at the moment, so, i expect crypto to be bullish in the coming days.

DOGE/USDT – 3D Long Signal Active📅 April 29, 2025
The system triggered a long entry at the last 3D bar close.
Currently, the price remains around the same levels.
✅ System conditions for a long are fully met:
MLR > SMA > BB Center > PSAR
Price is trading above the 200 MA on the 3D timeframe.
⚠️ Caution:
On the 1D timeframe, price is still below the 200 MA, which suggests some lingering weakness. Proceed carefully.
📍 Strategy Plan:
Consider entering long at today’s daily close or at the next 3D bar close.
Suggested stop-loss: below the latest PSAR dot for system integrity.
🔔 Keep an eye on updates and thank you for reading! 📈📊

DogeUsdt Full Target Hello friends, this deal has also reached full target, Spot fell about 6%.
please support and give energy.
May you always be profitable 🌹

DOGE - Time to buy again!I think that price level at 0.382 has a good support, and from here the price can grow well.
Give me some energy !!
✨We spend hours finding potential opportunities and writing useful ideas, we would be happy if you support us.
Best regards CobraVanguard.💚
_ _ _ _ __ _ _ _ _ _ _ _ _ _ _ _ _ _ _ _ _ _ _ _ _ _ _ _ _ _ _ _
✅Thank you, and for more ideas, hit ❤️Like❤️ and 🌟Follow🌟!
⚠️Things can change...
The markets are always changing and even with all these signals, the market changes tend to be strong and fast!!

DOGE Breaks Out: Bullish Momentum Ahead?DOGE Breaks Out: Bullish Momentum Ahead?
Analysis: DOGE has completed a bullish Broadening Wedge Pattern and has now broken out, suggesting the uptrend might continue. Market optimism is also increasing due to President Trump's announcement of a 90-day pause on reciprocal tariffs.
From its current position, DOGE could climb towards 0.1720, the first resistance level. A stronger resistance awaits near 0.1925, where the price was previously rejected.
You may find more details in the chart!
Thank you and Good Luck!
❤️PS: Please support with a like or comment if you find this analysis useful for your trading day❤️
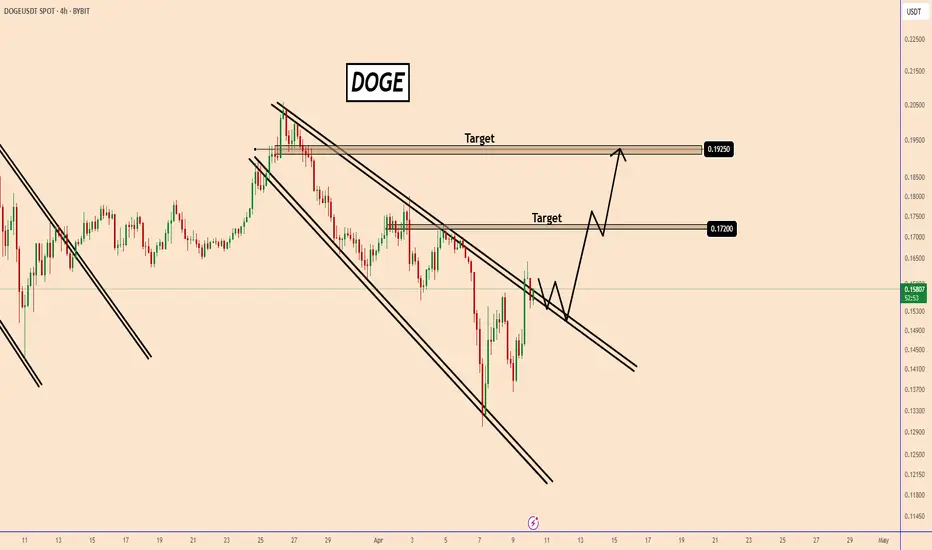
Lingrid | DOGEUSDT Potential LONG on Pullback to SWAP ZoneThe price perfectly fulfilled my last idea . It reached the target. After a strong rally and fake breakout above the resistance near 0.1915, BINANCE:DOGEUSDT is now pulling back and trading inside a sideways range. Price is heading toward the 0.1700–0.1710 support area, which aligns with the upward trend-line. If bulls hold this zone, a rebound toward 0.1850 looks likely. As long as price stays above the trend-line, bullish structure remains valid.
📈 Key Levels
Buy zone: 0.1700 – 0.1710
Buy trigger: bounce from trend-line
Target: 0.1850
Sell trigger: break below 0.1700
💡 Risks
If price breaks below 0.1700, it may open the way toward deeper support.
Sudden spikes in Bitcoin or market-wide sentiment shifts can shake the setup.
Lower timeframe volatility near trend-line could trap early entries.
Traders, if you liked this idea or if you have your own opinion about it, write in the comments. I will be glad 👩💻

Doge short to 0.16863Just hopped into this doge short. Time sensitive. Expecting a fall to 0.16863 today before monthly close.
DTT strategy applied
Entry and stops on chart and target
Time sensitive

DOGECOINDogecoin (DOGE) is a cryptocurrency that originated as a fun, meme-inspired digital coin but has gained significant popularity and market presence.
Founder of Dogecoin
Dogecoin was created by Billy Markus and Jackson Palmer in December 2013.
Billy Markus, a software engineer from the United States, and Jackson Palmer, a marketer from Australia, developed Dogecoin as a lighthearted alternative to Bitcoin, incorporating the popular "Doge" internet meme featuring a Shiba Inu dog.
The founders aimed to create a more approachable and fun cryptocurrency with a strong community focus.
Founders Billy Markus and Jackson Palmer
Origin Created in December 2013 as a meme-based, fun cryptocurrency
Market Outlook Moderate growth expected in 2025, with price forecasts reaching $0.24 by May
Dogecoin remains popular due to its active community, wide acceptance for tipping and microtransactions, and occasional high-profile endorsements.
