doge midterm buy"🌟 Welcome to Golden Candle! 🌟
We're a team of 📈 passionate traders 📉 who love sharing our 🔍 technical analysis insights 🔎 with the TradingView community. 🌎
Our goal is to provide 💡 valuable perspectives 💡 on market trends and patterns, but 🚫 please note that our analyses are not intended as buy or sell recommendations. 🚫
Instead, they reflect our own 💭 personal attitudes and thoughts. 💭
Follow along and 📚 learn 📚 from our analyses! 📊💡"
DOGEUSDT.P trade ideas

Dogecoin Outlook after the Dip. What to expect NOW?Because of politics and misleading news, we are now witnessing these prices, and this caused most of my analyses to be wrong and not go according to my thoughts. However, now the price has a strong support area that if it reacts to it, the price will go up to $0.26 and create a V pattern. Since this market is filled with some politicians and some Persons & their misleading promises, maybe the price will drop again and go down to $0.17 and then grow again.
Give me some energy !!
✨We spend hours finding potential opportunities and writing useful ideas, we would be happy if you support us.
Best regards CobraVanguard.💚
_ _ _ _ __ _ _ _ _ _ _ _ _ _ _ _ _ _ _ _ _ _ _ _ _ _ _ _ _ _ _ _
✅Thank you, and for more ideas, hit ❤️Like❤️ and 🌟Follow🌟!
❗Disclaimer
⚠️Things can change...
The markets are always changing and even with all these signals, the market changes tend to be strong and fast!!

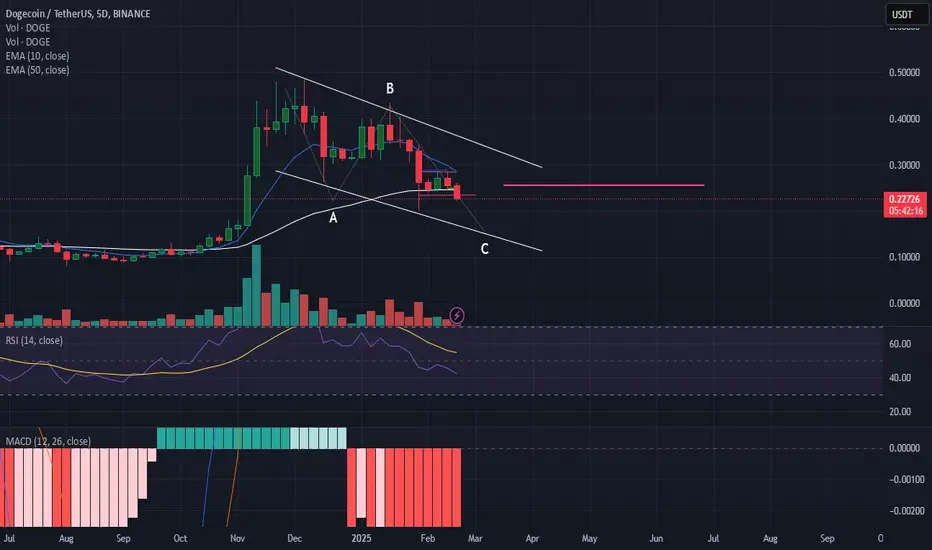
DOGE update#DOGE is making a descending wedge with 5 elliot waves also its goind down to a demand zone which i think is able to force the market rise again this correction structure is based on the divergence of the last 2 highs in the market check this out

Be careful with DOGE !!!The price drops to around 0.21 and then pumps to 0.29 cents.
and if this wedge is broken, you will no longer see cardano below 23 cents.
Give me some energy !!
✨We spend hours finding potential opportunities and writing useful ideas, we would be happy if you support us.
Best regards CobraVanguard.💚
_ _ _ _ __ _ _ _ _ _ _ _ _ _ _ _ _ _ _ _ _ _ _ _ _ _ _ _ _ _ _ _
✅Thank you, and for more ideas, hit ❤️Like❤️ and 🌟Follow🌟!
❗Disclaimer
⚠️Things can change...
The markets are always changing and even with all these signals, the market changes tend to be strong and fast!!

are we in Bear Market right now ?Good Morning everyone.. I want to say, in this year there is no Alt Season.. we can see second layer like ETH BNB down 20 - 40% from ATH and the third layer like DOGE, SOL already down 0-60%.. How about the last layer or we call meme coin already down 80 - 90% from ATH..
Wdyt about this cycle ?

DOGE 24 hr potterboxesDOGE Doge coin has broken thru the floor of the top box and is now heading for the roof of the lower box. $.19645 , there is still empty space to the left that has to be made up. The boxes are my best guess of whats going to happen. lets hope and pray that it starts to go back up. this could be a buying oppertunity. Happy trading.

DOGEUSDTFrom the perspective of the strong relationship between Elon Musk and the U.S. government, as well as the technical and fundamental analysis of Dogecoin, this trading setup appears highly logical.

DOGEUSDT 1D#DOGE is moving inside a falling wedge and has lost the daily MA200. If it loses the wedge support, it may test the support level of $0.20197 and the ultimate support zone. So, consider placing buy orders there.
Targets are:
🎯 $0.30998
🎯 $0.37154
🎯 $0.45918

Incoming 50% for Dogecoin ??**short term analysis - Days and weeks ahead**
On the above 3 day chart price action has enjoyed a massive 320% rally over the last 2 months thanks to you know who.
A number of reasons now exist to be “short”, despite the myriad of long ideas currently on the platform.
1) Price action prints bearish divergence.
2) Price action was recently outside the Bollinger Band. We know 95% off all price action trades around the mean, which is currently 50% below.
3) Remaining on the Bollinger Band notice the slight inward curve (red arrows)? This is informing you the current extension in price action is now exhausted.
4) Lastly, support and resistance. 20 cents was resistance for multiple months. Healthy market structure would see past resistance confirm as support before the continuation of the uptrend.
Is it possible price action continues upwards and onwards? Sure.
Is it probable? No.
Ww

Bull Meme: Golden BreakthroughThe first meme coin draws a bull flag! You know, it's like finding an undervalued stock in a pile of garbage - rare, but it happens. In the medium term, I expect the growth to 1.618 Fibonacci levels - the golden ratio, friends, nature is not wrong. Plus, a small bullish divergence is coming.
Horban Brothers.

DOGE SELL NOW!!!!!1DOGE took out the sell side liquidity with a retest am looking forward to see price create new lows 0.180 is my main target
JOIN AND ENJOY

DOGE ANALYSIS📊 #DOGE Analysis : Update
✅There was a formation of Falling Wedge Pattern on daily chart.
We could expect bullish move if #DOGE breaks the pattern and also breaks the major resistance zone.
👀Current Price: $0.2436
🚀 Target Price: $0.3400
⚡️What to do ?
👀Keep an eye on #DOGE price action and volume. We can trade according to the chart and make some profits⚡️⚡️
#DOGE #Cryptocurrency #TechnicalAnalysis #DYOR

DOGEfor some reasons i never looked after doge, when i first had a lot of doge, i never thought it will even cross 1 cent, but here we are, today things is different and as i woke up and open my phone saw an notification where was saying that doge etf is on its way and doge will how 10$ or more.. repeating myself, when i had lots of doge i did not believe....
back on track, support area is marked with the reversal line and i think that there is the reversal point to long.
nfa
dyor

DOGEUSDT Ready for a Bullish Surge!Hello traders! 👋
If you're thinking of buying DOGE or are already in a position, you need to read this! Hopefully, this analysis will provide helpful insights for everyone.
Bullish Scenario:
After touching the daily level, DOGEUSDT has shown a strong bullish reaction with momentum to the upside.
The price has entered an accumulation phase, creating a significant supply/demand zone on the 2-hour timeframe.
A bullish scenario is emerging, but confirmation will come only after breaking the 2-hour supply zone. If that happens, it could present a great entry opportunity to catch the beginning of the upward move.
Enjoy 😀

doge sell midterm"🌟 Welcome to Golden Candle! 🌟
We're a team of 📈 passionate traders 📉 who love sharing our 🔍 technical analysis insights 🔎 with the TradingView community. 🌎
Our goal is to provide 💡 valuable perspectives 💡 on market trends and patterns, but 🚫 please note that our analyses are not intended as buy or sell recommendations. 🚫
Instead, they reflect our own 💭 personal attitudes and thoughts. 💭
Follow along and 📚 learn 📚 from our analyses! 📊💡"

DOGE: Paws and ReflectIf you find this information inspiring/helpful, please consider a boost and follow! Any questions or comments, please leave a comment!
DOGE Bull Variant: Key Levels & Bullish Confirmation
Dogecoin (#DOGE) is showing some bullish potential, but it’s far from a done deal. While we’ve seen a reaction out of the Golden Corner Pocket, the bulls still have work to do before confirming a sustained move higher. Here’s what I’m watching to determine if this setup is worth my money.
Golden Corner Pocket Reaction – But Is It Enough?
A reaction from a Golden Corner Pocket is often a strong technical signal that suggests a potential continuation in trend. However, a reaction alone isn’t enough—it’s the follow-through that matters. Right now, DOGE has made a move, but I need clear bullish confirmation before considering a trade.
Step 1: Breaking Above $0.25 in an Impulse
For bulls to prove themselves, $0.25 is the first key level to clear in a strong impulse. This move would indicate buying strength and a willingness to push beyond resistance zones. Without this break, the reaction out of the Golden Corner Pocket could be nothing more than a short-term bounce.
Step 2: Taking Out a Lower High
After breaking $0.25, the next sign of strength will be taking out a prior lower high. This would indicate a shift in market structure and signal a stronger bullish trend development rather than just a temporary push up. Until this happens, the setup remains unconfirmed.
Risk Management: If Bulls Don’t Deliver, I’m Out
I’m not in the business of hopium trades—if the bulls fail to step up, DOGE doesn’t get my money. Simple as that. Without a clean breakout and confirmation of bullish intent, I’ll remain on the sidelines and wait for a better opportunity.
Final Thoughts
Right now, DOGE is at a crucial moment—a reaction out of the Golden Corner Pocket is promising, but $0.25 needs to break with conviction, and we need to clear a lower high to establish bullish control. Until then, I’m watching but not committing.
What’s your take? Do you think DOGE bulls have what it takes, or are we looking at another failed rally? Drop your thoughts below!
Trade safe, trade smart, trade clarity.

#DOGEUSDT remains weak📉 SHORT BYBIT:DOGEUSDT.P from $0.23740
🛡 Stop Loss: $0.24040
⏱ 1H Timeframe
✅ Overview:
➡️ BYBIT:DOGEUSDT.P broke support and exited the rising wedge, signaling a bearish trend shift.
➡️ POC (Point of Control) at $0.25386 now acts as key resistance.
➡️ The price dropped sharply with increased volume, confirming strong selling pressure.
➡️ Liquidity has shifted lower, increasing the probability of continued downside movement.
⚡ Plan:
➡️ Enter short at $0.23740 after confirming downward momentum.
➡️ Stop-Loss set at $0.24040, above the nearest resistance level.
🎯 TP Targets:
💎 TP1: $0.23410
🔥 TP2: $0.23155
🚀 BYBIT:DOGEUSDT.P remains weak — expecting further decline toward key targets!

doge buy midterm"🌟 Welcome to Golden Candle! 🌟
We're a team of 📈 passionate traders 📉 who love sharing our 🔍 technical analysis insights 🔎 with the TradingView community. 🌎
Our goal is to provide 💡 valuable perspectives 💡 on market trends and patterns, but 🚫 please note that our analyses are not intended as buy or sell recommendations. 🚫
Instead, they reflect our own 💭 personal attitudes and thoughts. 💭
Follow along and 📚 learn 📚 from our analyses! 📊💡"

doge long midterm"🌟 Welcome to Golden Candle! 🌟
We're a team of 📈 passionate traders 📉 who love sharing our 🔍 technical analysis insights 🔎 with the TradingView community. 🌎
Our goal is to provide 💡 valuable perspectives 💡 on market trends and patterns, but 🚫 please note that our analyses are not intended as buy or sell recommendations. 🚫
Instead, they reflect our own 💭 personal attitudes and thoughts. 💭
Follow along and 📚 learn 📚 from our analyses! 📊💡"

Doge: weekly Time frameAccording to Elliott and Wave Counting, Doge will soon enter the fifth rising wave. The main goal of the fifth wave:
54 to 56 cents.

DogeA pattern that we can expect to form with a downward movement in Dogecoin. This is just an analysis. What do you think?

Price Reactions to Drawn ZonesIn line with capital management principles, a two-phase entry is recommended. Please note that this is solely an analysis and not a financial or trading recommendation. The responsibility for any risks taken lies with the readers. Wishing you success.
