Dogecoin analysis: the important range...hello friends
Due to the good growth we had, now the price has been corrected and the range has been determined, which was a gap. Now it should be seen that it can maintain its support range.
In this case, we can move with it to the specified goals.
*Trade safely with us*
DOGEUSDT.P trade ideas

DOGE LongPrice trading comfortably above 9day EMA , just above the 0.25 demand zone.
Chart pattern formation looks like a bull flag. Pole and retracement waves present.
ETF's are about to be approved (for a meme coin my God).
Very bullish on Dogecoin from here. Long till 0.45 supply zone

#DOGE READY TO EXPLODE OR BREAKDOWN? KEY LEVELS TO WATCHYello Paradisers! Are you paying attention to #DOGEUSDT? This setup looks too good to ignore. #Dogecoin is sitting at a make-or-break level:
💎#DOGE is currently in a corrective phase following its impulsive five-wave rally (1-2-3-4-5). The price has been consolidating inside a broadening descending channel, forming a classic A-B-C correction pattern. Right now, #DOGE is hovering around a major support zone between $0.1444 and $0.2024—a crucial area where buyers need to step in.
💎For bulls to take control, we need to see a breakout above the descending resistance. If #DOGEUSD manages to break out convincingly, the first target is $0.30, followed by a potential rally toward the strong resistance zone at $0.48-$0.60. But remember, if there is no breakout, there will be no bullish confirmation.
💎The support zones between $0.20-$0.14 are very important. What if #DOGE fails to hold support? The bullish setup will become invalid if the price breaks below the $0.14 level. This could open the door for a deeper drop, potentially pushing DOGE below $0.10, where the market would need to find fresh buyers to avoid a complete breakdown.
💎If RSI and MACD show bullish divergence near the support zone, this could signal the end of the correction and the start of a new impulse wave. But without this confirmation, the risk of further downside remains.
Stay focused, patient, and disciplined, Paradisers🥂
MyCryptoParadise
iFeel the success🌴

Tips & Tricks by CandleStyxI was observing Dogecoin on the 1 HR and came up with all these observations and maybe you can learn some new ways to look at things if you can understand my scribbles.
Some clues I noticed:
1. possible cup n handle formation
2. The arrows are all copy pasta same lengths and time
3. Apart of the big breakout arrow which measures the size of the cup from top to bottom.
4. Look at the date ranges numbers
5. See the Fibonacc Golden Pocket has ideal level for a Handle
6. It would also retest the breakout from the ascending green triangle
7. Target of the Cup and Handle pattern is right into the resistance & liquidity and would be the first deep test of its strength
8. Interesting that the breakout is programmed to be exactly nearby the weekly and 2 week candle close
9. Keeping in Mind the Biweekly Bitcoin crossing macd to downside could it be a failing outbreak?
10. Also they say that if the handle comes deeper than 12% it will most likely fail.
11. Conclusion is to observe if we go lower than 12% as that could be a clue if the outbreak could be a trap or not.
12. Grab this Chartlayout and make it yours!
Tell me in the comments what YOU think will happen and explain why.
More updates might follow.

DOGE/USDT 1H: Institutional Markup Underway – Targeting 0.29!DOGE/USDT 1H: Institutional Markup Underway – Targeting 0.29!
🚀 Follow me on TradingView if you respect our charts! 📈 Daily updates!
Market Structure & Momentum:
Bullish Breakout: Price has broken out strongly from the accumulation range with a clear retest.
Pattern: Completed accumulation phase with a breakout and successful retest.
RSI: At 68.61, showing strong momentum but edging toward overbought territory.
Hidden Bullish Divergence: Present on RSI during the recent retest, reinforcing bullish strength
.
Smart Money Analysis:
Accumulation Complete: Institutional accumulation occurred between 0.245 - 0.26.
Volume Profile: Displays strong institutional buying, confirming the markup phase.
Liquidity Grab: Clear liquidity grab was executed before the current move.
Outlook: Expect continuation after any minor pullback.
Trade Setup (Confidence 8/10):
Entry: 0.27907 (current level after retest)
Targets:
T1: 0.285
T2: 0.29
Stop Loss: 0.274 (below recent support)
Risk Score: 7/10 – Favorable risk/reward; however, watch for overbought conditions.
Recommendation:
The risk/reward is favorable for longs at this point. Enter at 0.27907, and keep stops tight at 0.274. Monitor for any pullbacks before riding the move toward 0.29.
🚀 Follow me on TradingView if you respect our charts! 📈 Daily updates!

doge sell midterm"🌟 Welcome to Golden Candle! 🌟
We're a team of 📈 passionate traders 📉 who love sharing our 🔍 technical analysis insights 🔎 with the TradingView community. 🌎
Our goal is to provide 💡 valuable perspectives 💡 on market trends and patterns, but 🚫 please note that our analyses are not intended as buy or sell recommendations. 🚫
Instead, they reflect our own 💭 personal attitudes and thoughts. 💭
Follow along and 📚 learn 📚 from our analyses! 📊💡"

The Doge Chart They Don’t Want You to See!Hello Dear Traders,
Previously Doge chart was published but for some Reasons they Hidden it.. violated House Rules ;(
Here it is again .
This chart uses Gann Fan levels to analyze price movements for Dogecoin (DOGE/USDT) on Binance. The yellow lines represent key Gann levels that can act as support and resistance zones.
Key Observations:
1️⃣ Support Level at $0.20823
This level acted as a strong support where the price recently bounced.
If the price drops again, this could be a critical level to watch for a potential reversal.
2️⃣ Resistance at $0.26366 (Current Zone)
The price is currently testing this Gann level.
A breakout above could push the price toward the next key resistance.
3️⃣ Next Major Resistance at $0.32506
If DOGE maintains momentum above $0.26366, the next significant resistance is $0.32506.
A breakout above this level could trigger further upside movement.
Possible Scenarios:
🔹 Bullish Case: If the price holds above $0.26366, we could see a rally toward $0.32506. A break above this would confirm strong bullish momentum.
🔹 Bearish Case: If the price gets rejected at this level, it may revisit $0.20823 for another test.
💡 Conclusion: DOGE is currently at a decision point. A breakout could lead to higher levels, while rejection might bring a retest of lower Gann levels.
Final Note!
Watch before this happens like previous:
🚀 What’s your take on this? Are you bullish or waiting for confirmation?

$DOGE looking good hereDogecoin, considering the strong hype around meme coins, Elon Musk’s support, and its strong uptrend on the weekly timeframe, could be a good buy opportunity.
It's currently sitting on the 55 EMA and also at the 61% Fibonacci level, providing strong support.
I’ll wait for its reaction to see how the weekly candlestick closes.

Dogecoin Poised for a Breakout Amid Government Efficiency PlansThe cryptocurrency world is abuzz with excitement as Elon Musk’s Department of Government Efficiency (DOGE) takes center stage, not only for its ambitious plans to streamline federal operations but also for its indirect impact on the meme-inspired cryptocurrency, Dogecoin. With the official launch of the DOGE website (doge.gov) and the announcement of sweeping governmental spending cuts, the crypto market is witnessing a renewed wave of optimism around Dogecoin.
Elon Musk’s Influence and DOGE’s Growing Relevance
Elon Musk, the billionaire entrepreneur behind Tesla and SpaceX, has long been a vocal supporter of Dogecoin, often tweeting about the meme coin and even integrating it into payment systems for Tesla merchandise. His latest venture, the Department of Government Efficiency (DOGE), has further cemented the connection between Musk and the Dogecoin community. While the initiative is focused on reducing government spending by $2 trillion over the next four months, the mere association with the DOGE acronym has reignited interest in the cryptocurrency.
The launch of doge.gov, which promises to provide updates on cost-saving measures and federal operational efficiencies, has created a sense of anticipation among investors. Musk’s involvement in this governmental advisory panel under Trump’s presidency has added a layer of credibility and intrigue, further fueling speculation about Dogecoin’s potential role in the broader financial ecosystem.
Moreover, the broader macroeconomic environment is playing a role in Dogecoin’s appeal. With U.S. inflation data for January coming in at 3% year-over-year, higher than expected, Musk’s plans to slash government spending could have a deflationary impact. Analysts like Charles Gasparino of FOX Business have suggested that achieving the panel’s goals could bring inflation down to 2%, which would be a boon for risk assets, including cryptocurrencies. This macroeconomic backdrop is creating a favorable environment for Dogecoin to thrive.
Technical Analysis
From a technical perspective, Dogecoin is showing strong signs of a potential bullish reversal. At the time of writing, Dogecoin is trading at $0.2579, up over 4% intraday, with an RSI (Relative Strength Index) of 47. This indicates that the asset is neither overbought nor oversold, leaving ample room for upward movement.
Key Technical Indicators
1. Fibonacci Retracement Levels: Dogecoin has recently broken above the 38.2% Fibonacci retracement level, a critical resistance point. This breakout suggests that the coin is poised for further gains, with potential targets at $0.4993, $0.5740, and $0.6543 if the bullish momentum sustains.
2. Support and Resistance Levels: The one-month low of $0.2489 is acting as a strong support level, providing a safety net for investors in case of a pullback. On the upside, the immediate resistance lies at $0.267, which, if breached, could open the door for a significant rally.
3. RSI and Momentum With the RSI at 47, Dogecoin is in a neutral zone, indicating that there is no immediate selling pressure. This positions the coin for a potential trend reversal, especially if buying volume increases.
4. Community and Elon Musk’s Support: Dogecoin’s strong community backing, combined with Elon Musk’s continued influence, adds a layer of fundamental support to the technical setup. The meme coin’s ability to rally on sentiment and news cannot be underestimated, as seen in previous cycles.
Conclusion
Elon Musk’s Department of Government Efficiency (DOGE) has created a perfect storm for Dogecoin, blending fundamental optimism with a strong technical setup. As the official DOGE website goes live and Musk’s plans to slash government spending take shape, Dogecoin is well-positioned to capitalize on the resulting market sentiment.
With key technical indicators pointing to a potential breakout and the broader crypto market showing signs of bullishness, Dogecoin could be on the verge of another historic rally. For investors, the coming weeks and months will be crucial as they watch for confirmation of the bullish trend and the realization of Musk’s ambitious goals.

DOGEUSDT 4DDOGE ~ 4D Analysis
#DOGE Time frime 4D forms a bullish flag pattern. Buy gradually from this support block with a minimum target of 20%+.

DOGEDOGE back up to the Yearly Open at .31 (on full moon strength) seems like an inevitability.
Also, return to yearly vpoc.

Docecoin DOGE price analysisExactly 3 months ago, we made our last post about CRYPTOCAP:DOGE 👇
We wrote that according to our idea, the OKX:DOGEUSDT price made a +300% price movement and entered the sales zone.
Since then, #Dogecoin has managed to make an A-B-C correction of -55% and test the “mirror” zone for strength.
In principle, +/- now the price of CRYPTOCAP:DOGE is much more interesting to buy into an investment portfolio than it was before. But we'll probably - pass.
😭 Rumor has it that the next target for #DOGEUSD is $1 - do you believe it?
_____________________
Did you like our analysis? Leave a comment, like, and follow to get more

DOGE - Time to buy again!The price has formed a Triangle on the 4h time frame, and if it breaks out, it can drive the price up to around $0.30.
Give me some energy !!
✨We spend hours finding potential opportunities and writing useful ideas, we would be happy if you support us.
Best regards CobraVanguard.💚
_ _ _ _ __ _ _ _ _ _ _ _ _ _ _ _ _ _ _ _ _ _ _ _ _ _ _ _ _ _ _ _
✅Thank you, and for more ideas, hit ❤️Like❤️ and 🌟Follow🌟!
⚠️Things can change...
The markets are always changing and even with all these signals, the market changes tend to be strong and fast!!

DOGEUSDT can breakout major daily support and fall to 0.12$As we can see price now is near major and last support zone if the market continue to fall then the support near 0.25$ will also break and i am expecting more -50% fall to the targets and supports like 0.12$.
Notice: only if this support hold we may have range market here for a while and rise and gain.
DISCLAIMER: ((trade based on your own decision))
<<press like👍 if you enjoy💚

Possible Cup and Handle on Doge or J HookIf this CnH plays out then Dogecoin is on the road to 1.09 or the 2.16 fib "safely" being 50% of the measure move along side using the previous J Hook it produced before hand. But this must maintain the .5 Fib. If we manage to sustain the .5 Fib but fail to break above .44834 (1 Fib) then it's possible that we are in 3 waves pattern. Good luck trading!

doge buy midterm"🌟 Welcome to Golden Candle! 🌟
We're a team of 📈 passionate traders 📉 who love sharing our 🔍 technical analysis insights 🔎 with the TradingView community. 🌎
Our goal is to provide 💡 valuable perspectives 💡 on market trends and patterns, but 🚫 please note that our analyses are not intended as buy or sell recommendations. 🚫
Instead, they reflect our own 💭 personal attitudes and thoughts. 💭
Follow along and 📚 learn 📚 from our analyses! 📊💡"

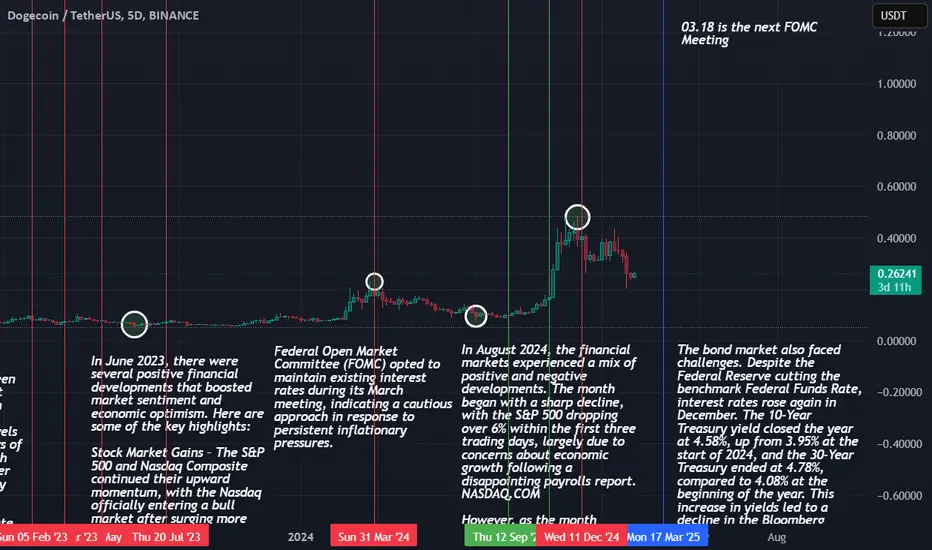
Dogecoin and Interest Rates RelationshipDogecoin PUMPS when we have Rate cuts and Dumps when we have Rate Cuts or delayed cuts. Red line = negative data on inflation and Green Line are the Rate Cuts. I also included the top financial news for those events and all Rate Decisions from the FOMC.
Doge / USDT : retesting after breakout - Next big move ?DOGE/USDT: Retesting After Breakout – Next Big Move?
DOGE/USDT is at a crucial juncture 📈 as it successfully broke above key resistance and is now retesting the breakout zone 📊. This retest is a critical phase that could confirm the continuation of a strong bullish trend 🚀. If support holds, we may see another leg up soon. Keep a close eye 👀 on price action and volume for confirmation.
Key Insights:
1️⃣ Breakout & Retest: DOGE/USDT has cleared a significant resistance level and is now testing it as support. Holding above this zone could signal a strong bullish continuation.
2️⃣ Volume Confirmation: Watch for a surge in buying volume on the retest to confirm that bulls are stepping in 🔥.
3️⃣ Momentum Indicators: RSI and MACD are still trending positively ⚡, reinforcing the potential for further upside.
How to Confirm the Retest Success:
✅ Price holds above the previous resistance and establishes it as new support.
✅ A strong bounce from the retest zone with increasing volume confirms buying interest 📊.
✅ A bullish 4H or daily candle formation signals trend continuation 📍.
⚠️ Be cautious of failed retests that could lead to a deeper pullback or fakeouts.
Risk Management Strategies:
🔒 Use stop-loss orders to protect against unexpected reversals.
🎯 Manage position sizing to align with your risk tolerance and trading plan.
This analysis is for educational purposes only and not financial advice. Always DYOR before making any trading decisions 🔍.

Dogecoin: Breakout from Strong Structure ZoneDogecoin: Breakout from Strong Structure Zone
Dogecoin (DOGE) has broken out from a robust structure zone near $0.2600. This breakout appears solid, suggesting the potential for further price increases from this zone.
However, the price may pause as the market awaits Fed Chair Jerome Powell's testimony. The market does not anticipate any new developments from Powell, but his comments could influence the timing of the next bullish wave.
You may find more details in the chart!
Thank you and Good Luck!
❤️PS: Please support with a like or comment if you find this analysis useful for your trading day❤️

Dogecoin roadmap (new update) 3DIt's time to take a step back from Elon Musk's favorite coin!
From the point where we placed the red arrow on the chart, it seems that Dogecoin's major correction had begun, and at the point where we placed the green arrow, Dogecoin's bullish phase started—a large, multi-year phase.
This bullish phase, based on price-time rules, appears to be a diametric or symmetrical pattern.
Now it seems that wave E of this large diametric has completed, and the price is entering wave F, which is a bearish wave.
Previous corrective waves of this diametric lasted between 196 and 347 days, so wave F is also expected to last between 196 and 347 days.
Similar to waves B and D, wave F is expected to be highly volatile.
Between the two vertical lines and within the horizontal green zone, the correction for wave F is expected to conclude, transitioning into wave G. Wave G will be a bullish wave that might lead to a new ATH (All-Time High).
A weekly candle closing below the invalidation level will invalidate the buy outlook for the green zone.
For risk management, please don't forget stop loss and capital management
Comment if you have any questions
Thank You

$1 per DOGE? This is not just a dream...Hello Traders 🐺
Dogecoin is showing strong bullish signals and seems to be on the path to significant growth. Reaching $1 might be closer than you think! 📈🔥
But why am I telling you this? 🤔
As you can see in the chart, DOGE has broken above the purple resistance line , which was a major monthly resistance ! Now, it's forming a bull flag pattern right above it. 🚀
Even during the last market dip, DOGE successfully retested this resistance as a strong support , confirming its strength. In my personal opinion, this bull flag is about to break out —and the target ? Yes, around $1 ! This could mean a massive 300% pump !
Are you ready for the move ? 🐕

Doge to about $4Doge coin after the rally had and broke the previous high, and now back-testing with ABC correction waves.
As daily RSI is too low, I'm expecting a rally to $1.50 to complete wave 3 before and the wave 4 & 5

Assumed channelHello friends.
Such a channel can be considered.
Are we going up or down?
what is your opinion?
Good luck.
# Let's look simply
