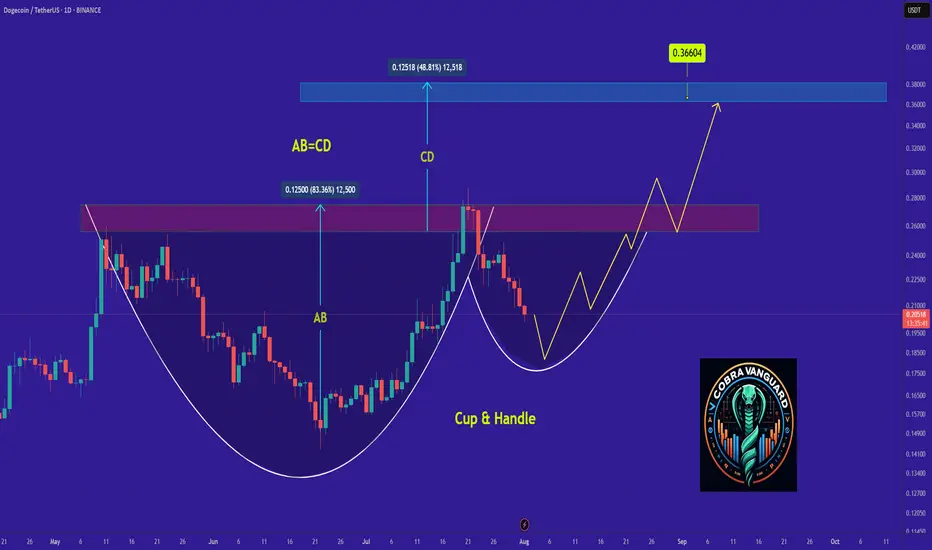
Why DOGE Remains Bullish and Its Next Potential Move !It appears that the price is forming a cup and handle pattern, and if this occurs, it could push the price above $0.30.
Best regards CobraVanguard.💚
DOGEUSDT trade ideas
Those daily +20% to +30% candles soon will appear!!Those Fibonacci levels which are last supports for healthy & #Bullish market are all touching i mean the 0.218$(0.5 #Fibonacci) & 0.202(0.61 #Fibonacci) and i think these supports are strong enough to stop the correction and soon again it will pump and even can break daily high near 0.42$ and hit targets like 0.5$ and 0.75$.
DISCLAIMER: ((trade based on your own decision))
<<press like👍 if you enjoy💚

DOGE/USDT | Eyes Bounce from Key Support – Next Targets Ahead!By analyzing the Dogecoin chart on the daily timeframe, we can see that after reaching the $0.29 area, the price entered a correction and is now trading around $0.22. If DOGE dips into the key support zone between $0.19–$0.21, we could expect a strong bullish reaction. The next potential targets are $0.287, $0.32, $0.41, and $0.70.
Please support me with your likes and comments to motivate me to share more analysis with you and share your opinion about the possible trend of this chart with me !
Best Regards , Arman Shaban

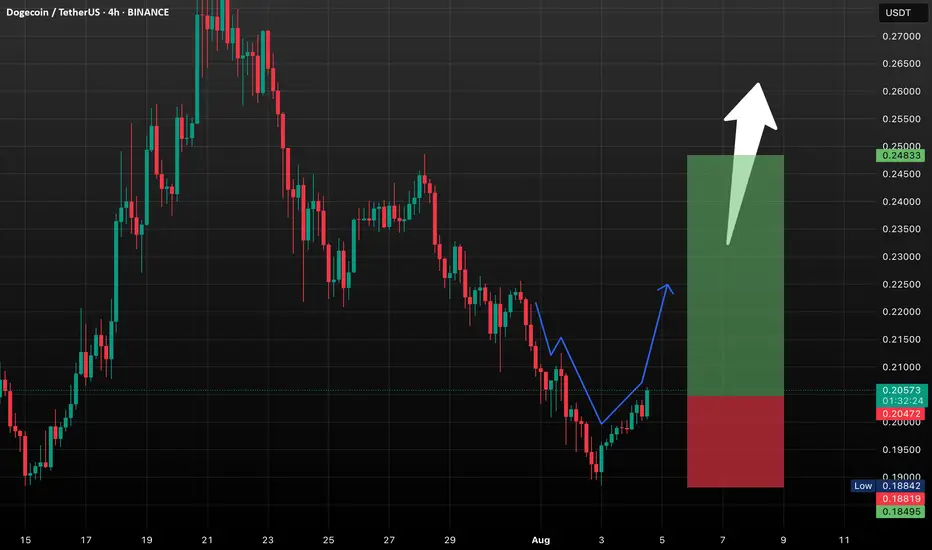
Lingrid | DOGEUSDT Pullback and Continuation OpportunityBINANCE:DOGEUSDT is currently testing the intersection of its upward channel support and a critical horizontal zone near 0.21378, after a steep corrective decline from the 0.28628 resistance area. The recent price action formed a rounded pullback, suggesting potential accumulation near trendline confluence. A bullish bounce here could trigger a strong rally toward 0.26350 as shown by the projected upward path. Failure to hold the 0.21000 area would expose the pair to deeper downside toward the 0.15706 support.
📌 Key Levels
Buy zone: 0.21000–0.21700
Buy trigger: Break and close above 0.23000
Target: 0.26350
Invalidation: Break below 0.21000
⚠️ Risks
Breakdown of ascending trendline support
Weak volume on upward breakout
Broader market weakness impacting altcoins
If this idea resonates with you or you have your own opinion, traders, hit the comments. I’m excited to read your thoughts!

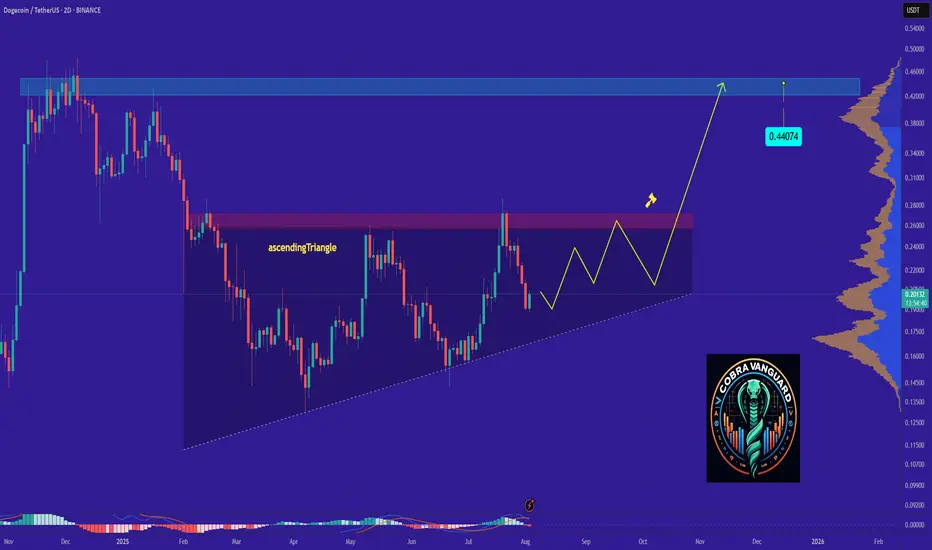
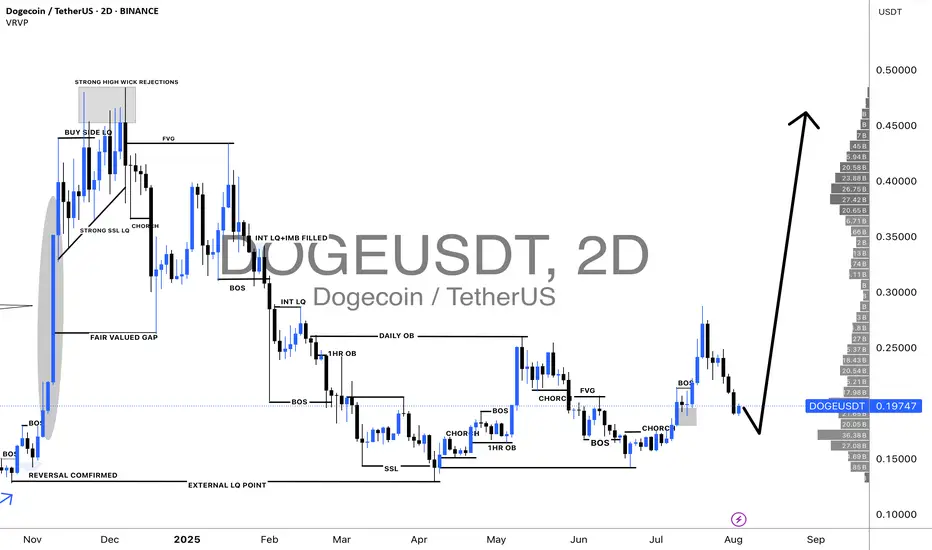
DOGE's Situation, A Comprehensive Analysis !!!The price on the 2d timeframe is within an ascending triangle, which can be promising. If the price breaks this pattern with bullish candles, it could easily rise by the distance of AB=CD .
Best regards CobraVanguard.💚
DOGE kill all leverage players and now ready to rocketAbout 30% of dump is insane and huge amount even for the holders which where positive and happy about new market pump after years but this market specially the BINANCE:DOGEUSDT market makers are in another level of surprising us.
but soon i think we will see huge gain and pump here so get ready!!
DISCLAIMER: ((trade based on your own decision))
<<press like👍 if you enjoy💚

Dogecoin Bullish · $0.70 & 240% Profits PotentialThis is a great chart setup and I can even say it looks better than Cardano, but why? Because prices are lower, therefore there is more room available for growth. So it really depends on how you look at it.
Seeing Dogecoin producing a rising channel is good, but knowing that prices are still really low compared to the last high (December 2024) and also compared to the all-time high tells us that there is still plenty of room available for growth and it is early. The rising channel after the correction ended reveals that the market—traders, holders, investors, etc.—are buying and accumulating for what comes next. Can be anything, but everybody is already buying...
The current higher low support was found right in-between 0.618 and 0.786 Fib. retracement levels. Here marked with blue dotted and purple dotted lines.
We could say that it is possible to see two to three days green followed by another low, a lower low, and this is definitely possible but there is no bearish momentum, no sell side force. And thus we can conclude on an early end for this retrace. Another reason is the fact that the rise is more steep now compared to April, so the retrace should also be more steep and have a shorter lifespan. Agree, agree, agreed.
Dogecoin produced a perfect channel with higher highs and higher lows, the next move is a major jump with resistance at $0.70 and total growth potential reaching 240%. We can continue with this pattern and track the market long-term. It is what I do; it is what we have been doing for countless years now... And we are only getting started.
The best is yet to come.
Thank you for reading.
Namaste.

Bears Target $0.14 DOGE — Is the Trend Your Friend?DOGEUSDT has been in a clear downtrend since late July, printing consistent lower highs and lower lows. The current market structure shows sellers firmly in control, with every bullish bounce quickly fading. The recent rejection near $0.2244 and the inability to sustain above the $0.21 zone highlight persistent selling pressure.
At the moment, DOGE is hovering around $0.2043, just under a short-term resistance band between $0.2067 and $0.2090. This area has acted as a rejection point in the last few sessions, suggesting that unless bulls can break above it with strong volume, the path of least resistance remains downward. Below, the first major support sits at $0.1855. If that breaks, the selling could accelerate toward $0.1680, a level that aligns with a previous consolidation base from June. In an extended decline, $0.1427 comes into view as a long-term support level that previously acted as a strong demand zone.
The chart also shows an active short trade setup in play:
• Entry: $0.2043
• Stop-Loss: $0.2244
• Targets: TP1 at $0.1855, TP2 at $0.1680, and TP3 at $0.1427
From a risk-reward perspective, this setup remains attractive, especially if the price breaks below $0.1855. However, traders should watch for any bullish invalidation signs — a close above $0.2136 could challenge the short bias, while a sustained break above $0.2244 would signal a possible trend shift. Until then, the broader technical picture still favors the bears.

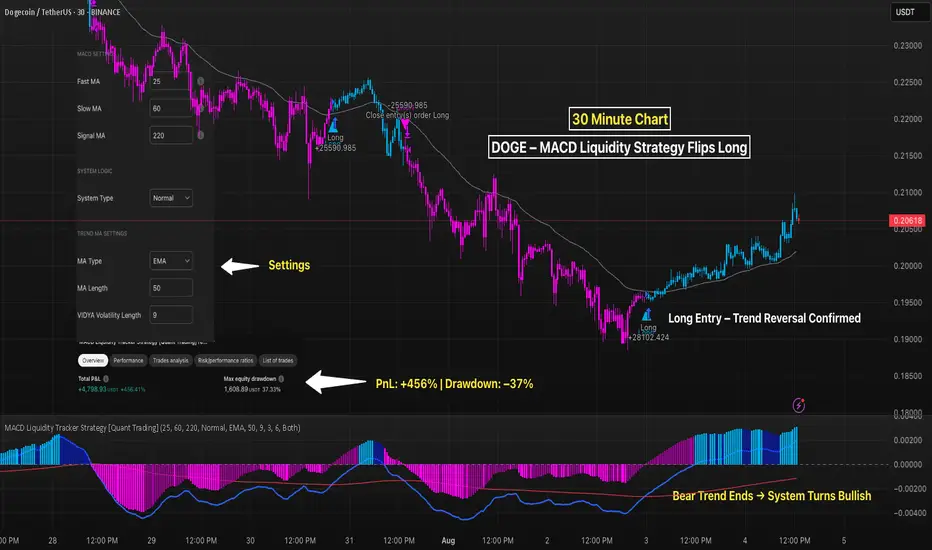
DOGE 30M – MACD Liquidity Strategy Flips Long With MomentumDogecoin just flipped bullish on the MACD Liquidity Tracker Strategy, with a fresh long signal printed around $0.191. After a sustained downtrend marked by persistent short bias (purple candles), the system has now confirmed a trend reversal — backed by both price structure and MACD momentum.
The histogram flipped blue, price reclaimed the trend EMA, and candles turned from purple to blue — all indicating a shift in control.
📈 Strategy Settings:
– Fast MA: 25
– Slow MA: 60
– Signal MA: 220
– Trend Filter: 50 EMA
– Mode: Normal
📊 Backtest Performance (on this symbol + timeframe):
– Total PnL: +456.41%
– Max Drawdown: –37.33%
– Best suited for momentum reversals after consolidation or stop-hunt spikes
If this momentum holds, DOGE could retest local highs around $0.215+ — but a breakdown back below $0.20170 would invalidate the setup.
This system does the heavy lifting — you just follow the signal.
👇 Drop “QTP” below and we’ll send you the full strategy access.
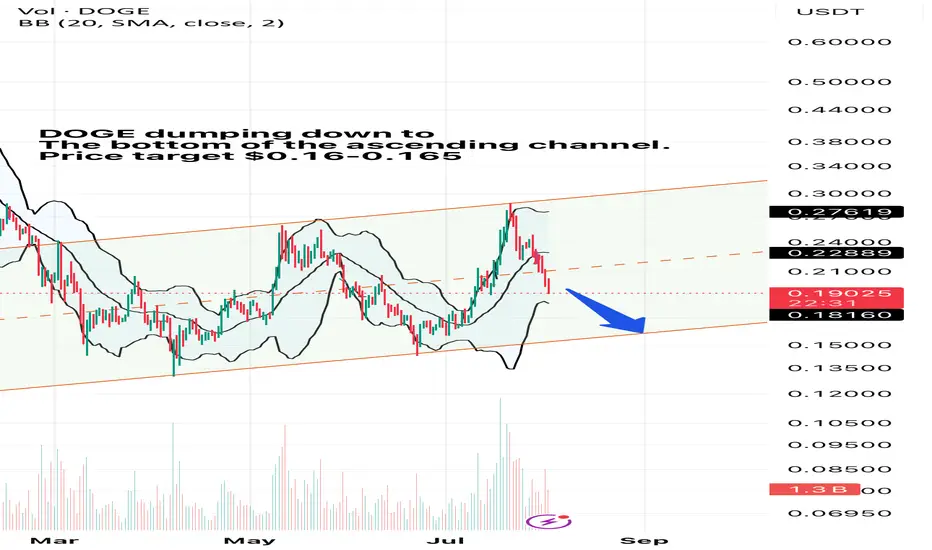
DOGE dumping will end soon.DOGE has been moving within the ascending channel. After hitting the upper resistant level of the channel, it has been dumping since then. Currently heading down to the bottom of the channel. Price Target $0.16-0.165
DOGE Setup Heating Up: These Levels Could Define the Next Move!Prediction for the Period Ahead (Next 1–2 Weeks):
*Base case: Holding support at $0.198–$0.200 → test $0.215.
*Bull trigger: Break above $0.215 with volume → possible move to $0.232 and higher.
*Downside risk: Falling below $0.182 could drag the price to $0.175 before any recovery.
DOGE is currently consolidating in a tight range with a neutral to slightly bearish technical bias. However, a breakout above $0.215, particularly supported by volume, could set the stage for further gains targeting $0.232–$0.287 zone. Conversely, a downturn past $0.182 opens the risk of a deeper test toward $0.175. In either scenario, the upcoming weeks seem pivotal...
You Got Liquidated, Whales Used Your Liquidity To Fuel PumpsEver got stopped out right before a massive pump?
Felt like the market dipped just to take your position out?
Maybe it’s time to see whale pullbacks from a different angle...
Hello✌️
Spend 2 minutes ⏰ reading this educational material.
🎯 Analytical Insight on Dogecoin:
BINANCE:DOGEUSDT has breached all key Fibonacci supports and now rests on a critical daily support level. If this holds, a potential 20% upside toward 0.25 becomes likely. 📊🛡️
Now , let's dive into the educational section,
💣 Deep Game of the Market: Pullback or a Setup?
When we hear “pullback” we usually think of a buy opportunity. But is it always that simple? Or are some pullbacks just strategic moves by whales to hunt your liquidity?
Before major bullish moves the market looks for one precious thing: liquidity from over-leveraged poorly placed traders.
💡 How Whales Think 🤔
The biggest mistake retail traders make is assuming the market is fair
It’s not
Sudden pullbacks aren’t random They’re engineered to trigger SLs of over-leveraged traders absorb liquidity and kick off the real bullish move
🧠 Fear and Greed Psychology 😱
Retail trading is powered by two emotions
Fear leads to premature exits and tight stop-losses
Greed causes reckless entries without confirmation
These are exactly what whales feed on The market moves where emotions are strongest and liquidity is highest
🔄 After the Pullback: Time to Pump 🚀
Once the liquidity is taken the real game begins
The pump usually starts from the same level where your SL just got triggered
You’re out they’re in
This is where experience and structure reading come into play
📌 Real Pullback vs Whale Pullback 📉
A real pullback respects structure reacts to known zones and comes with volume confirmation
A whale pullback is usually fast erratic and hits zones that retail traders commonly use for SLs especially without logical support on the chart
🔁 This Pattern Repeats Just Look Back
Take a look at BTC or ETH history
Before almost every major pump there’s been a sharp fast dip that wiped out leveraged longs
Is that a coincidence or a well-crafted liquidity strategy?
🛠 How to Avoid Being Liquidated 🔐
Don’t place SLs in obvious local zones
Use volume-based tools seriously
Wait for multi-layer confirmations such as price action volume and liquidity
Avoid over-leveraging and don’t play the whale’s game
📊 Read Charts Like Maps Not Casinos 🧭
Charts tell you everything but only if you learn the language
Once you understand what whale pullbacks look like you’ll stop being a victim of pumps and start riding them
🧰 TradingView Tools to Catch Whale Pullbacks
Reading fake pullbacks or liquidity grabs isn’t easy with just candles. But TradingView offers a range of tools that act like night vision goggles in this game
🔹 Liquidity Zones Indicators: Tools like Liquidity Swipes or Session High and Low help spot areas where SL hunts are likely
🔹 Volume Profile: Highlights zones with heavy trading activity revealing where whales are likely building up positions
🔹 Relative Volume (RVOL): Spikes in volume during fast drops often signal fake pullbacks and trap setups
🔹 Fair Value Gap (FVG): These imbalanced zones usually get revisited and are prime zones for whale entries
🔹 Heatmaps (external tools): Connected to TradingView these show high liquidity zones which are perfect spots for SL hunts
Combining these tools gives you the edge to trade like a pro not a target
📎 Final Thoughts and Tip
If your SL keeps getting hit before every major move you’re not unlucky you’re playing exactly into their plan
Start using TradingView’s tools learn to read liquidity and always question whether that dip is really a pullback or a trap
✨ Need a little love!
We pour love into every post your support keeps us inspired! 💛 Don’t be shy, we’d love to hear from you on comments. Big thanks , Mad Whale 🐋
📜Please make sure to do your own research before investing, and review the disclaimer provided at the end of each post.

DOGEUSD bullish wedge BREAKOUT - wait for candle to close. DOGE/USD has broken out of the bullish wedge pattern. The 4-hour candle has not yet closed, so it's best to wait for confirmation. Consider entering the trade on a retest of the breakout level.
Target: Around $0.25
Stop Loss: Around $0.20
Let’s see how it plays out.
DOGEUSDT: Get Ready For Big Move!! Bulls has the controlDogeusdt currently retesting the demand area and ready to rebound. This move may finally create another record higher high. Please use risk management while trading crypto market. Good luck and trade safe!
Team Setupsfx
DOGEUSDT Technical Analysis – Bullish Reversal Anticipated DOGEUSDT Technical Analysis – Bullish Reversal Anticipated
🔍 Key Technical Zones:
Support Zone: $0.1990 – $0.2015
Strong bullish reactions noted from this level in previous attempts.
Confluence with volume accumulation on the left (as seen in the Volume Profile).
Signifies a strong demand zone where buyers are stepping in.
Resistance Zone / Target: $0.2220 – $0.2240
Previous structural high and supply zone.
Marked as the first major liquidity area.
Also aligns with imbalance and CHoCH (Change of Character), a common SMC concept.
🔄 Market Structure:
CHoCH (Change of Character) marked multiple times, indicating attempts by bulls to reclaim structure.
Recent price action shows accumulation near support.
Sideways consolidation suggests potential for a bullish breakout.
Liquidity sweep of recent lows could indicate that smart money is accumulating positions before a move higher.
🎯 Trade Setup Idea:
Entry Area: Between $0.2000 – $0.2060 (inside the support zone)
Target: $0.22396 (as marked)
Stop Loss: Below $0.1980 (below the visible support range)
🔧 Indicators and Tools Used:
Volume Profile (VRVP): Shows most volume traded around $0.205 – $0.207, indicating strong positioning from market participants.
Smart Money Concepts (SMC): CHoCH and liquidity concepts signal potential accumulation and reversal.
Price Action Analysis: Clean swing structure with support-resistance rotation visible.
📌 Conclusion:
DOGEUSDT is currently trading in a range-bound structure with a bullish bias from the support zone. If the price sustains above $0.205 and breaks above minor resistance, the upside target of $0.22396 is likely. This setup is supported by strong volume accumulation and smart money structure shifts.

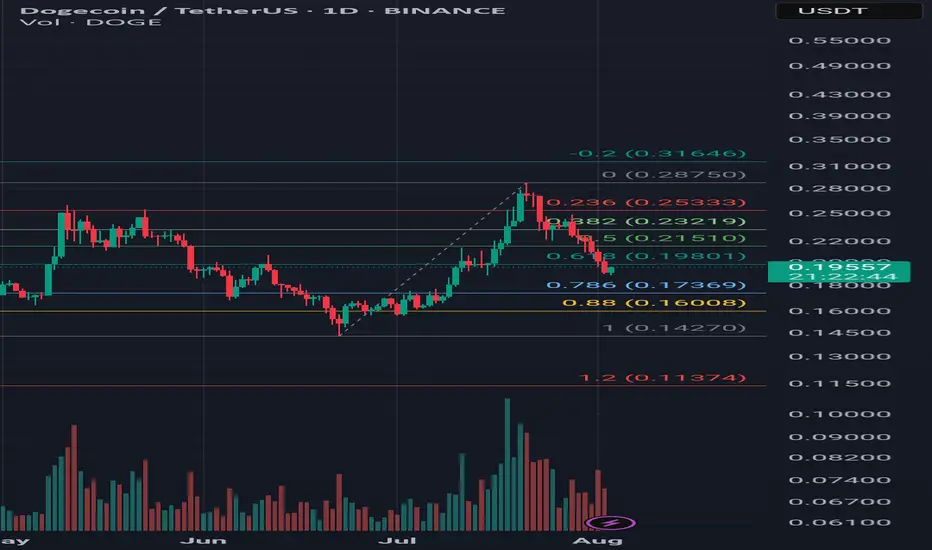
DOGE/USDT Trade Idea – Potential Cup & Handle Pattern Timeframe: Technical Analysis:
Price rallied from 0.142 to 0.287 and is currently forming the handle of a potential cup & handle pattern.
Price is sitting at the key 0.618 Fibonacci retracement level (0.198 USDT).
If this support holds and price breaks above resistance levels with strong volume, the cup & handle pattern may activate.
---
🎯 Targets:
1. First resistance: 0.215 USDT (50% Fib)
2. Second resistance: 0.232 USDT (38% Fib)
3. Key breakout level: 0.287 USDT
4. Classic pattern target: 0.432 USDT
---
🛡 Stop Loss:
Below 0.170 USDT (slightly under the 0.786 Fib & handle bottom)
---
✅ Entry Confirmation Criteria:
1. Hold above 0.198 support
2. Break and close above 0.215
3. Breakout above 0.287 with strong volume
---
💡 This analysis is for educational purposes only and is not financial advice. Always use proper risk management.
DOGE 1H – MACD Liquidity Strategy Captures Long/Shorts This chart showcases the MACD Liquidity Tracker Strategy running on DOGE 1H — using optimized settings tailored for crypto volatility. With a 100% gain on this run and multiple entries capturing major moves, this configuration continues to show powerful edge on low timeframes.
🔹 Strategy Details
Strategy Type: Normal
MACD Settings: Fast 25 / Slow 60 / Signal 220
Trend Filter: EMA (50) with VIDYA smoothing
Short trades disabled for directional clarity in volatile trends
🔹 Trade Highlights
Captured a +27.24% move on the initial breakout
Re-entered on trend continuation, banking +15.84% on the rebound
Just fired another long signal off recent lows — potential bounce forming?
🔹 Backtest Stats
Total PnL: +997.35 USDT
Win Rate: ~50%
Max Drawdown: 49.92%
Ideal for traders comfortable with high-volatility setups and swing entries
Would you trust the MACD Liquidity Tracker for your DOGE entries?
Let me know how you’d tweak it 👇

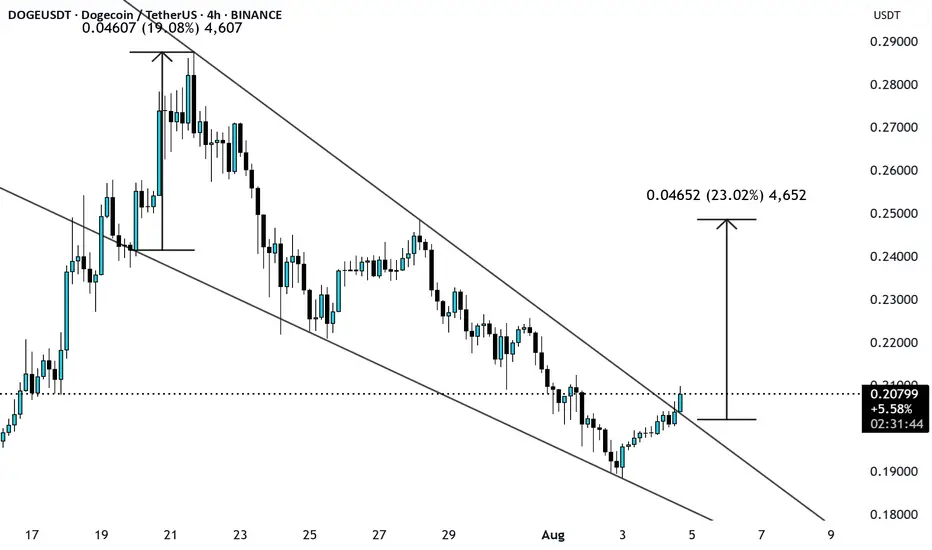
DOGEUSDT is testing 0.5 Fibonacci support (more gain)As we can see the breakout of red trendline also completed and volume increases after that and now market is testing major Fib levels like 0.5 & 0.61 soon we can expect more pump and gain here like the green arrows.
so many stop loss also hit on this fast correction to the downside and price is ready to start next boom pump with kicking out leverage buyers first.
DISCLAIMER: ((trade based on your own decision))
<<press like👍 if you enjoy💚

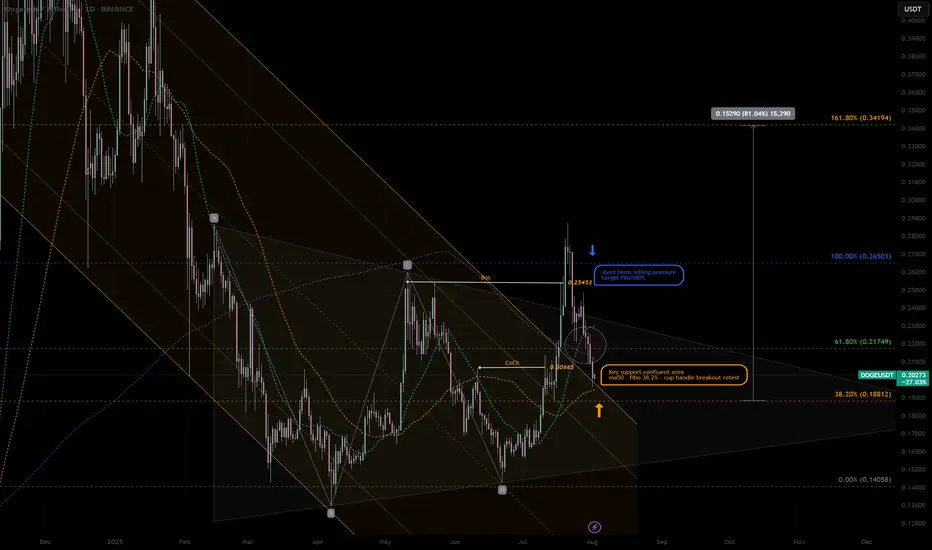
DOGEUSDT|Pullback Confluent Support -cup&handle next ext. +80%DOGE - retraced at the confluent support zone, high potential pullback buy position:
- SMA50 Dynamic support—often attracts mean-reversion buys.
- cup & handle support retest Price retested prior breakout zone—flips resistance to support.
- key 38% Fib “sweet spot” pullback level after corrective moves.
- Previous Change of Character marks shift from bearish to bullish structure—support confluence.
Potential Entry & Risk Management
Entry Zone
- Aggressive: immediate handle breakout support
- Conservative: Wait for liquidity pattern and re-bounce confirmation candle above SMA50
Stop-Loss
-Below Cup Handle low -10% larger position prior swing high RR:2.5/1
-Suggested SL: previous low -0.17 USDT - 5% below entry
Initial Targets
-Key resistance 61.8% Fib retracement — 0.217 USD
-100% Prior swing high — 0.26 USD
-162% Next extended target - 0.35 USD
Trade Rationale
-Mean-reversion into SMA50 and Fib 38.2% zone aligns multiple buyers.
-Pattern support: Cup & handle retest confirms breakout strength.
-Structure flip: CoCh zone indicates bullish regime shift.
Watch-Outs
-Rejection below 0.188 USD erodes support cluster—invalidates setup.
-Rising volume on bounce is crucial—low-volume lifts often fail.
-Beware broader market sell-offs impacting altcoins.
Next Steps:
-Monitor 4-hour candlestick close inside entry zone.
-Check volume spike on reversal candle.
-Adjust risk dynamically if price gravitates toward upper channel resistance.
Always trade with affordable risk and respect your stop..
TradeCityPro | DOGE Faces Resistance with Altseason Tailwinds👋 Welcome to TradeCity Pro!
In this analysis, I want to review the DOGE coin for you. One of the first and most popular shitcoins in crypto, which managed to attract a very strong market cap during the previous bull run due to the hype around Elon Musk.
🔍 Currently, this coin has a market cap of $34.06 billion and ranks 8th on CoinMarketCap.
📅 Daily Timeframe
In the daily timeframe, this coin has created a very strong support level at 0.15190, and now after a bullish leg, it has formed a top at 0.27359.
📊 The buying volume increased nicely during this bullish leg, and the price moved up to the 0.27359 resistance.
✔️ Now, after the first touch, the price has started a slight correction and is moving downward. If further touches occur, we can open a long position after breaking the top.
📈 Breaking 0.27359 could be one of those positions that stays open all the way up to 0.46496, and we can buy this coin in spot using the profit from that trade. I will try to have a position open after breaking 0.27359, aiming for 0.46496.
💥 The next trigger we have is the break of 0.31222, but the price should first form some structure after reaching that area, and only after confirmation should we open a position. Just entering based on that break doesn’t seem logical to me.
🔽 If a correction and drop happen, as long as the price stays above 0.15190, there’s no problem for the trend to continue. But if the price stabilizes below that level, a trend reversal might occur.
📝 Final Thoughts
This analysis reflects our opinions and is not financial advice.
Share your thoughts in the comments, and don’t forget to share this analysis with your friends! ❤️

dogeusdtMy opinion is based on the Arti M strategy. Share your thoughts with me. Is your opinion right or wrong?

DOGE/USDT Technical Analysis – Breakout AnticipationDOGE/USDT Technical Analysis – Breakout Anticipation
As of the current market structure, DOGE/USDT is showing signs of a potential bullish reversal from the demand zone (support), aiming toward the projected target at 0.27253 USDT.
🔍 Chart Structure & Price Action
Support Zone (0.21873 – 0.22568): The price has previously respected this area, making it a strong demand zone where buyers stepped in.
Resistance Zone (0.27756 – 0.29000): A key supply zone where previous rallies halted. This is the ultimate test for bulls after the breakout.
Current Price (0.23743) is showing consolidation above the support, suggesting accumulation before a move.
🧠 Technical Indicators
Supertrend Indicator: Currently flipping to bullish (10,3 settings), indicating potential upside continuation.
Volume Profile (VRVP): Shows high volume nodes around the support level, confirming strong interest from institutional players or large orders.
Market Structure: A higher-low is forming, indicating early signs of a bullish market shift.
🎯 Target
The projected move towards 0.27253 USDT aligns with previous price action and supply zone interaction. A clean breakout from the current consolidation could fuel momentum toward this level.
🎓 Educational Insight
This setup reflects the principles of Smart Money Concepts (SMC):
Price tapping into demand before impulse moves.
Liquidity grab at lows.
Break of structure (BOS) to the upside could trigger continuation.
Traders can learn the value of combining structure-based trading with volume analysis to improve entry precision and confidence.

3M CLS I KL - OB I Model 2 I Targe 50% CLSHey, Market Warriors, here is another outlook on this instrument
If you’ve been following me, you already know every setup you see is built around a CLS Footprint, a Key Level, Liquidity and a specific execution model.
If you haven't followed me yet, start now.
My trading system is completely mechanical — designed to remove emotions, opinions, and impulsive decisions. No messy diagonal lines. No random drawings. Just clarity, structure, and execution.
🧩 What is CLS?
CLS is real smart money — the combined power of major investment banks and central banks moving over 6.5 trillion dollars a day. Understanding their operations is key to markets.
✅ Understanding the behavior of CLS allows you to position yourself with the giants during the market manipulations — leading to buying lows and selling highs - cleaner entries, clearer exits, and consistent profits.
📍 Model 1
is right after the manipulation of the CLS candle when CIOD occurs, and we are targeting 50% of the CLS range. H4 CLS ranges supported by HTF go straight to the opposing range.
"Adapt what is useful, reject what is useless, and add what is specifically your own."
— David Perk aka Dave FX Hunter ⚔️
👍 Hit like if you find this analysis helpful, and don't hesitate to comment with your opinions, charts or any questions.
