DOGEUSDT soon above 0.20$ and then bull market is just startedAS we can see price is near two major daily supports which are:
A. 0.14$ B. 0.10$ and here near these two daily supports we can expect high volume pump and breakout of 0.21$ resistance and then after that the breakout pattern is completed and heavy pump will lead.
DISCLAIMER: ((trade based on your own decision))
<<press like👍 if you enjoy💚
DOGEUSDT trade ideas

DOGEUSDT: Time For Bulls To Rule! The Dogecoin is currently trading at a key buying level, making it a potential opportunity to buy. However, we need confirmation before making a purchase or entering a trade. This trade could take time to develop as we are currently in the accumulating phase. To be certain of the price direction, we need to enter the distribution phase. While a single swing trade could be a target, you can set your own risk management parameters.
Good luck and trade safely!
Team Setupsfx_

A powerful BULLISH awaits.It is swinging inside the famous pattern. It has completed the final arm. God willing, it will go towards the target of $1!

Dogecoin $1.17 Next Target (591% Profits Potential)From its June 2022 bear market low, Dogecoin managed to grow more than 880% to its December 2024 peak price. The peak happened around the 0.618 Fib. extension level.
The next major level based on Fibonacci proportions in relation to the 2021 bull market/2022 bear market stands at $1.17, this would give us 591% profits potential from current price and a total of 2281% total growth coming from the June 2022 bottom. That would the total size of the bull market for Dogecoin if it peaks at $1.17, more than 23X.
Prices go up but they don't remain up. After a bullish wave there is always a correction. After a bull market there is always a bear market.
Dogecoin is now back at baseline levels but within a higher low. All the same resistance levels that were conquered in late 2024 will need to be challenged again. All these levels will break easily. The main resistance will be found at $0.59 followed by the previous, 2021, all-time high, around $0.74.
What other resistance levels are relevant if the market doesn't perform great?
I will give you the exact numbers. Below the last high $0.35 is a relevant level. Hitting new highs compared to December 2024 $0.70 needs to be watched. New ATH $1.05 and the rest of the numbers mentioned before and shown on the chart.
My guess? Above $1.00. There is no reason for the market to peak any lower.
Thanks a lot for your continued support.
Namaste.

Dogecoin (DOGE): Ideal Buying Opportunity | Possible 200% UpDogecoin is in the sweet spot where we are expecting to see a proper upward movement happen very soon.
Seeing similarities to the last bullish movement we had, we are now at the end phase for the next upward movement.
As long as we stay above $0.14, we are sure that we will see a good move from here so be ready!
Swallow Academy
DOGECOIN Eyes Major Breakout – Trend Channel in Controlhello guys!
doge seems potential now!
DOGECOIN has successfully broken out of a long-standing bearish trendline and is now respecting a well defined ascending channel structure.
After a clean retest of both the midline and the demand block around 0.1950–0.2150, the price is showing renewed bullish pressure. As long as price holds above this key support zone, we can expect further continuation to the upside.
what I see:
✅ Breakout of descending trendline confirmed
✅ Strong structure support from the demand block (0.1950–0.2150)
✅ Clean reaction from channel midline
✅ Momentum currently favors continuation of the bullish trend
🎯 Bullish Targets:
TP1: 0.2530 (recent swing high)
TP2: 0.2750 (channel upper boundary)
TP3: 0.3035 (major horizontal resistance zone)
🛑 Stop-loss idea: Below 0.1950 (invalidates bullish structure)

DogeIt broke out on all TF. If nothing bad happens in the news I think it's goin to be profitable 😁😁

Trading plan for DOGEA new month has begun, and I've marked the key monthly pivot levels for you. I've also outlined potential scenarios based on the higher timeframe analysis. Additionally, I've highlighted important levels for this week's trading and identified setups that could drive price toward the resistance zone. However, in a bearish scenario where the trendline breaks, we might see a retest of the local low before any upward correction toward the $0.3 level
Full analysis is available in the video - happy trading!

DOGE - IDEA index to my B/ september pumpWe have an instrument — DOGE — and I see a certain pattern. From one pump zone to the next, it's 14.4 cm, and this happens three times. From the high zone after these pumps, it's 15.5 cm, also three times. From the high at $0.74 to the high at $0.48, we get 40.7 cm. Similarly, from the very first DOGE pump where the mega rally began, there's also a 40.7 cm gap to the next strong pump.
After analyzing the old “Sparta” idea
I came to the conclusion that the price is being compressed within a specific range, and after some time, this range gets multiplied by a numerological coefficient. To get 444, you need to multiply 333 by 1.333. But another coefficient close to this value is 0.69 (zone) multiplied by 2, which equals 1.38.
On the chart, you can see that from the starting point we have 14.4 cm. If we apply the derived coefficient (0.69) — taken from the length of the circle — we get 20.9 cm. That is, our diameter is 14.4 cm. If we multiply it by Pi (3.14), we get the circumference: 45.2 cm. Then, we need to find the 0.69 zone, which equals 0.69π = 2.166. That means we divide 45.2 by 2.166 and get 20.9 cm. If we measure this from our first control point (from where we took the diameter), we arrive precisely at the bottom from which the trend reversal began.
Now, keeping in mind the coefficient that the cycle follows — 1.333 — if it moved exactly, it would be too obvious and there wouldn’t be the necessary chaos on the chart. Since we have more than one cycle, multiplying 0.69 × 2 = 1.38 gives us 28.8 cm, which precisely points to the high formed at $0.23.
You might not believe me or understand, but these are facts. I’ve provided you with the chart — you can verify everything yourself.
What does this give us?
This provides us with valuable information about how the trend develops after the strongest initial pump of the instrument, allowing us to capture all the movements by trading within a channel using complex percentages and taking massive % gains.
What do we need to do? Let’s repeat:
Study the distance from the lows before the pump to the next low right before the next pump (in cm).
Then we carry this same cycle backward to confirm its validity in the past and again forward — that will be the main one from which strong growth begins.
From the measured value (in cm), we take it as the diameter and multiply by Pi to get the circumference, which helps us understand what might come in the future.
We trade the 0.69 zone or 69%, whichever is easier for you. To find this zone, divide the circumference by 2.166.
Then multiply the result by the coefficient 1.333 or 1.38 — this will show us the final zone of growth or decline.
This math can also be applied not only to centimeters but to time bars. For example, if from one low to the next is 492 days, you can use the same formulas to extract valuable insights.
So, what’s next for DOGE?
If the zones I’ve already mentioned have occurred, how do we trade the future?
When we extend the diameter — that is, the 14.4 cm cycle in our case — we do this three times. Pi is 3.14, so obviously:
14.4 × 3 = 43.2
Our Pi value is 45.2.
That means 2 cm to the right will be the low before strong growth. This falls around September 1st, give or take — meaning sometime within the first two weeks of September a strong rally should begin, with acceleration in late September 2025.
I came to all these conclusions after 2 hours of work and recently developed this linear strategy — or more precisely, I had a breakthrough on it — so I expect a lot more will be added as I continue writing the book.
I also realized something else: remember the correlation between the highs and the strong pumps at 40.7 cm? We apply the same formula:
40.7 / 2.166 = 18.8
Which precisely points to the low before the pump.
Then we take:
(40.7 / 2.166) × 1.38 = 26 cm
Which also points to the same low as the 20.9 cm from the beginning of the 14.4 cm diameter.
An incredible mathematical correlation found using the formula I discovered.
To back up my words, I will index this idea and publish this excerpt on TradingView so it’s visible and verifiable. I hope the idea plays out, and that DOGE forms a local bottom in early September, followed by strong growth with acceleration at the end of September.
To be clear, I just described how the internal structure works — and it is only Pi that points directly to the strong September rally. Let's see what happens.

Dogecoin (DOGE): Keeping Eye on 200EMA | Looking For BounceDogecoin is still hovering above the 200EMA, where we see some kind of weakness but the price still remains above the line so we are keeping our bullish game plan still active.
We are looking for a bounce on daily timeframe from 200EMA where we will be looking at $0.25 for a proper breakout, which then would send the price as high as $0.37
Swallow Academy

DOGEUSDT Buy Long SetupWait for entry, if the tp hits first, then ignore the trade, I will share new entry.

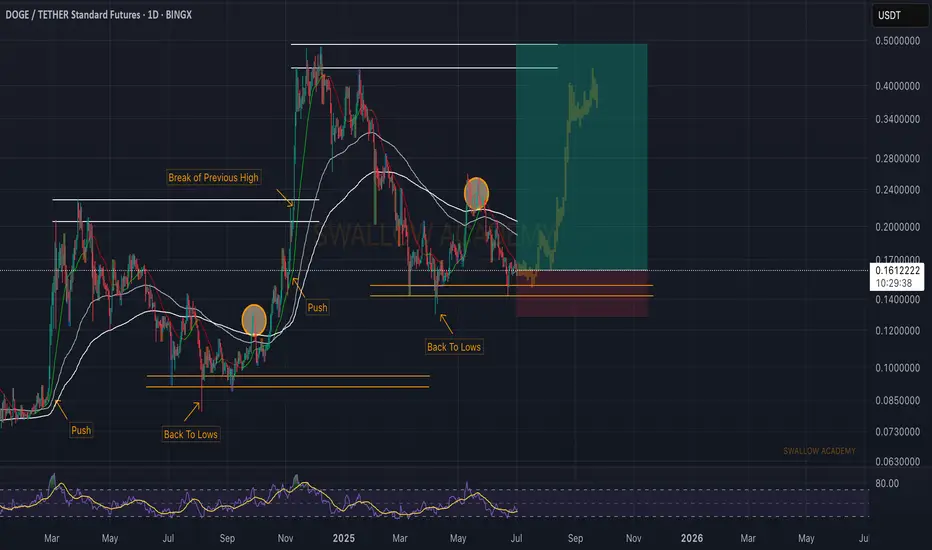
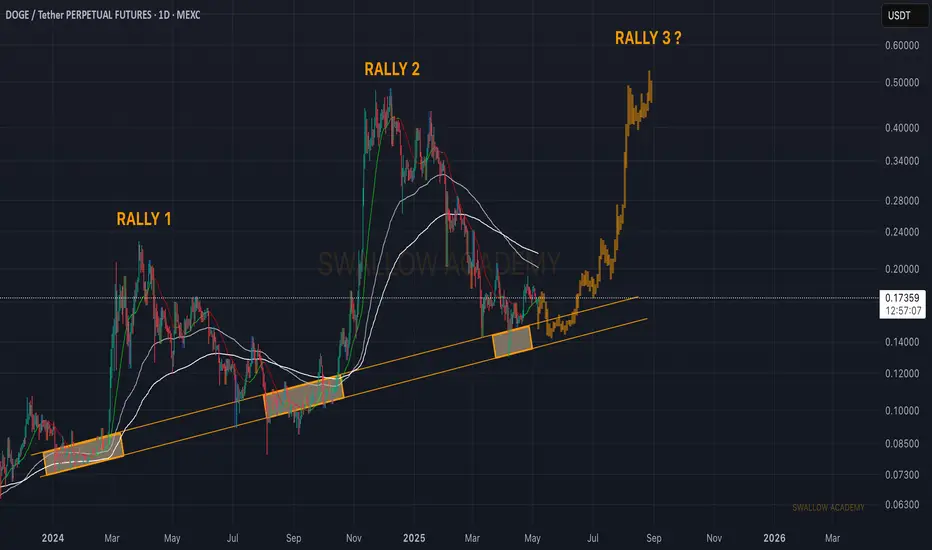
Dogecoin (DOGE): Getting Ready For Rally 3 | Possible Good BuyWe decided to take a broader look at Dogecoin, where we are seeing a price at a supportive trend, which might send the price to a very fast and quick upward movement, which could give us 200% market price movement from here.
We are going to keep this kind of game gameplan as long as we are above or inside our bullish trend line here.
Swallow Academy
DOGE, expanding upside pressure from 0.17 below. Targeting 0.4!DOGE had a good year last year 2024, going parabolic -- and reaching as high as 0.48.
Then as with any overheated price growth with the overall market, it went into extreme corrective mode -- trimming down as much more than 3x its price, tapping major lows at 0.14 area.
Now, based on its current long term metrics. We are now seeing some baselining action at the current price range at 0.17 area. Based on our diagram above, a hop signal has been spotted hinting of an expanding upside pressure on the present price zone.
DOGE has corrected to below bargain zone at 78.6 Fib levels. A no-brainer key area where buyers get the most discounted price. The MAJOR shift everyone is waiting for is currently transpiring this week.
Higher lows on long term momentum metrics has been registered as well -- conveying intense ascend pressure.
Ideal seed is at the current price and anything below 0.17 is a definite bargain.
Spotted at 0.169
Mid Target 0.5
Long term target 1.0
Trade safely. Market is still Market.
Not financial advice.
TAYOR.

#DOGEUSDT: Swing Trade Targeting $0.50| Swing Trade| Setupsfx_|Hey there! Everyone
DOGEUSDT is at a turning point right now, and it looks like it might just reverse course and head towards its target price of $0.50. This is a swing trade, which means it could take a few weeks, or even months, to complete.
We’d really appreciate your support.
Thanks
Team Setupsfx_

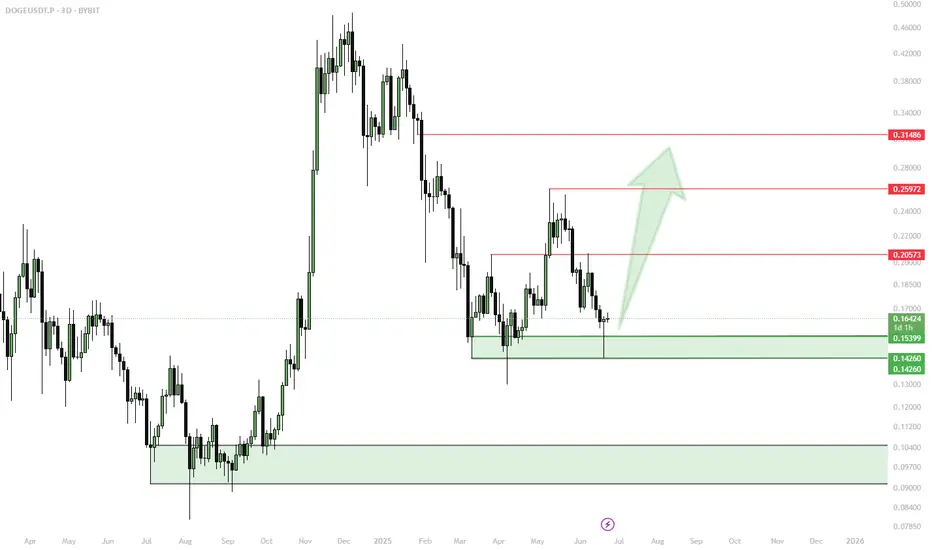
DOGE/USDT Rebound from Key Demand Zone! Bullish Rally Incoming?
🔍 Technical Analysis Overview:
1. Strong Demand Zone (Support Area):
DOGE has just bounced off a strong demand zone around $0.15000 – $0.16318, which previously acted as a significant accumulation area (highlighted in yellow). This signals a potential trend reversal from bearish to bullish.
2. Bullish Bounce Confirmation:
Price action is forming a potential "higher low" in this support area, indicating the early signs of a bullish structure.
3. Key Resistance/Target Levels: If momentum continues, DOGE could target the following resistance zones:
📍 $0.19637 – Initial minor resistance.
📍 $0.21000 – Previous consolidation area.
📍 $0.24911 – $0.31170 – Mid-term targets.
📍 $0.41583 – $0.48432 – Major resistance zone for long-term rally.
4. Short to Mid-Term Outlook:
The price is showing signs of a potential "V-shaped recovery." The yellow arrow suggests possible minor pullbacks before a continued bullish move toward higher resistance zones.
💡 Potential Strategy:
Entry: Look for re-entry opportunities on a retest of the $0.16 – $0.18 zone with bullish candle confirmation.
Stop Loss: Below $0.15000 (key invalidation level).
Take Profits: $0.196 – $0.249 – $0.311 – $0.415 (ladder out positions).
🚀 Conclusion:
DOGE is currently in an exciting technical setup, rebounding from a major demand zone with a strong potential for a bullish trend reversal. If volume supports and broader crypto sentiment improves, a strong upside rally could be in play in the coming weeks.
#DOGE #Dogecoin #DOGEUSDT #CryptoAnalysis #TechnicalAnalysis #Altcoins #CryptoTrading #Breakout #SupportAndResistance #BullishReversal

DOGE AccumulationI haven't made a post about Doge in a while. This seems like a good area to find a bottom, at least for a while. There was already an accumulation model 2 in April, but it seems like that was just intended to create a larger range to then accumulate on a bigger scale. Something like that would be a perfect scenario, but only time will tell.

DOGE/USDT Breakout Theft Plan| Smart Entry + Exit| Bullish Bias🐶💰 DOGE/USDT Master Heist Plan – The Bullish Breakout Robbery! 💸🔓
(Thief Trading Style – Steal Profits, Not Dreams)
🌟Hello, Hola, Ola, Bonjour, Hallo, Marhaba!🌟
To all the fearless Market Movers & Silent Operators out there – welcome to another strategic DOGE raid guided by technical precision and macro-level insight! 📈🧠
🔐 The Game Plan – Let’s Break the Bank!
This chart outlines our long-entry mission for DOGE/USDT, based on a unique Thief Trading Style strategy. The market currently shows bullish momentum, setting the stage for an upside breakout—but not without traps! Stay sharp.
💥 Key Concepts at Play:
Pullback Zones = Entry Points (Mark the lows, grab the loot)
ATR Line Zone = High-Risk Area (Time to plan your exit)
Reversal & Consolidation Zones = Watch for fakes & traps
News Events = Potential market detonators – keep your stop-loss close
📍Entry Point – "The Vault’s Open!"
💰 Plan A: Instant execution for those already prepped.
📉 Plan B: Place Buy Limit Orders near recent 15–30 min swing lows for a stealthier entry during pullbacks.
🚨Stop-Loss Setup – Safety First, Always
📍 Recommended SL: Near the 2H swing low (around 0.15500)
🛡️ Adjust based on your personal risk, account size, and trade volume. Thieves plan smart—never go in blind.
🎯Target – Clean the House and Vanish
🎯 Primary Target: 0.18500
⚠️ Exit early if market conditions shift. The first rule of the game? Don’t get greedy.
⚡Scalpers’ Mode – Hit & Run
Only trade LONG setups. Whether you’re a heavy hitter or playing it safe, stick with the bulls. Use trailing SL to protect the bag.
📊Why This Heist Works – Under the Hood
The DOGE/USDT setup is driven by:
✅ Bullish sentiment
✅ Fundamental trends
✅ Macro drivers
✅ On-chain activity & intermarket signals
✅ COT Reports & future momentum indicators
(For full breakdown, check linkkied data 👉🔗🔍)
📡News & Risk Management Reminder
🚫 Avoid opening fresh trades during high-volatility news events.
📉 Always trail your stop to secure profits during live positions.
Adapt fast – the market changes in a blink.
❤️Support The Plan
💥 Smash the Boost button to help spread the Thief Trading Style across the platform! Let’s make smart money together, one chart at a time. Every like, comment, and follow powers the next move. 💪💵🚀
🔔 More Heist Plans Coming Soon – Stay connected, stay dangerous... and stay profitable.
🐱👤Until then – Trade Smart. Trade Thief. Make Your Mark. 💸

Complete Analysis of DOGE/USDT 4hComplete Analysis of DOGE/USDT 4h
The chart suggests a transition phase toward an uptrend.
Moving averages are beginning to slope upward, indicating a potential trend reversal. The MACD shows weakening selling pressure and is approaching a bullish crossover, which often precedes upward price movement.
Entry zones: Between 0.14452 and 0.15185 — favorable areas for position accumulation.
Price targets:
First target: 0.20455 (a key resistance zone).
Second target: 0.22942, where stronger selling pressure may emerge.
Risk management: A suggested stop-loss at 0.13561 to protect capital if the anticipated move fails.
If the price breaks and consolidates above 0.17, the market could gain momentum to reach the projected targets. Monitor volume during breakout candles to confirm the presence of buying flow.

Doge still holding as planedSo SL was set perfectly, if nothing bad comes from Trump mouth we should be able to book profits🤣🤣

DodgeCoin - Speed Index is telling me ShortReading the chart
1.Location: Fib + touch AVWAP low
2. Speed Index numbers at top on the High side (red numbers) which means Hard to Move Up.
3. PRS Short signal
4. If we do not get stuck into range and break it downwards , it's Short!
Enjoy! Reading the chart with Speed Index!

DOGE Forming a Bottom — Risk/Reward Favor Bulls✅ DOGE looks “forgotten” — minimal interest, low volume, no panic selling
✅ Bottoming structure forming; bounce from key support, retest of lows possible
✅ Accumulation only via spot limit orders in green zones; avoid market buys
⚠️ No expectations of breaking ATH, targets capped at $0.31–0.38
1. Bullish Scenario (~55%)
Retest of support zones ($0.143–0.16), spot accumulation
Trigger: Bounce on volume, reclaim of previous quarterly levels
Partial profit: $0.25; main targets: $0.31–0.38
2. Sideways Scenario (~35%)
Consolidation between $0.14–0.18, low volume, slow accumulation
Work the range: accumulate at lows, trim on spikes, patience
3. Bearish Scenario (~10%)
Break below $0.14 with no demand, deeper altcoin market correction
Stop loss on close under $0.14, wait for new supports — no averaging down without buy signals
📝 Order Management & Recommendations:
Place spot limit orders only in $0.143–0.16 and lower green zones
No market FOMO entries
First take-profit: $0.25; main TP: $0.31–0.38
Hard stop/loss under $0.14; no holding through breakdowns
It's disappointing !!!Do you think this will happen, or do you see DOGE below $0.14 in the future?
Best regards CobraVanguard.💚

Buy setup by TiqGPT Analyzing the provided charts for Dogecoin/TetherUS across multiple timeframes, we observe a consistent pattern of consolidation and minor fluctuations within a defined range. The 1D chart shows a downtrend with recent attempts at recovery, marked by small bullish candles. The 4H and 1H charts indicate a ranging market with price oscillating around the 0.1635 to 0.1650 levels, suggesting a lack of strong directional momentum.
The 15M, 5M, and 1M charts further detail this consolidation, with price making higher lows and lower highs, indicative of a compression in volatility and potential preparation for a breakout. The repeated tests of the 0.1635 level across lower timeframes suggest it's a significant area of short-term support.
INSTITUTIONAL THESIS:
Institutions may be in a phase of accumulation within this range, using the lack of clear directional momentum to quietly build positions. The repeated support tests and tight consolidation indicate preparation for a potential upward move, as institutions capitalize on the compressed volatility to trigger a breakout.
