The Right Way to Manage Stop Loss: Dynamic Logic for Smart ExitsContext
In fast-moving markets, static stop losses often sabotage good trades by exiting too soon or too late. This approach uses dynamic, logic-driven stop loss adjustments that adapt to market context instead of sticking to a single fixed distance.
⸻
Key Principles of This Stop Loss Logic
Contextual Initial Placement
The stop is never just a fixed percentage below entry. It adapts based on recent swing lows/highs, ATR volatility, and trend confirmation signals.
Dynamic Extension in Favorable Conditions
If price retraces but shows bullish reversal evidence such as deep oversold signals, positive divergence, or compression breakouts, the stop loss is extended instead of closing immediately. This prevents cutting winners during normal pullbacks.
Tightening When Momentum Fades
If momentum weakens (for example, ADX drops, failed bounce, or resistance rejection), the stop is tightened dynamically. This reduces drawdown if the trend fails.
Clear Exit Triggers
The system can exit on consolidation breakdowns below support, confirmed bearish reversal patterns, or time-based exits if no continuation happens.
⸻
Examples and Visuals
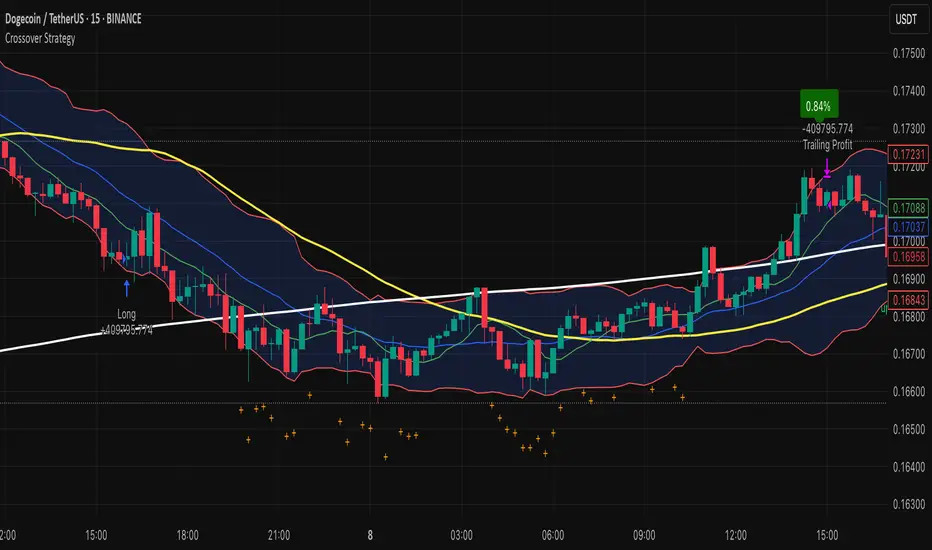
Below, I’ve included chart examples with screenshots from my Multi Crossover Strategy . These images illustrate how dynamic stop loss management behaves in real conditions—showing entries, extensions during retracements, and exits triggered by different scenarios. You can see how the logic responds to changing volatility and trend strength in real time.
The "+" signs mark bars where the position would have closed using the default settings of 2.5 ATR Multiplier stop loss. A bullish reversal signal extended the stop, allowing the trade to close profitably instead of at a loss.
This example shows an early exit triggered by a consolidation breakdown. The system closed the position before the maximum stop loss was reached, limiting the loss as bearish momentum increased.
Example for lower high close to reduce loss. Here, the position was closed after a failed bounce and the formation of a lower high, signaling a likely continuation of the downtrend and helping to reduce the loss before a deeper move.
⸻
Advantages Over Simple Stop Losses
Adaptation
Stops react to volatility and price structure, not arbitrary distances.
Risk Mitigation
Dynamic tightening locks in gains faster when momentum fades.
Confidence to Stay In
Dynamic extension reduces the chance of premature exits during healthy retracements.
⸻
How to Use This Approach
When designing your strategy, start by defining a volatility-adjusted stop using an ATR multiplier as the base distance from entry. You can then set a maximum allowable loss in percentage terms to cap risk exposure to a fixed threshold.
After establishing your initial stop, consider adding layered adjustments that respond to different levels of reversal risk. For example:
ATR Multiplier: the factor used to calculate the initial stop distance based on market volatility.
Maximum Loss (%): the maximum risk per trade, defined as a percentage below the entry price.
Tight Stop Loss (%): a closer stop level that activates when early signs of a potential reversal appear, such as weakening momentum or minor bearish movement.
Bearish Stop Loss (%): a further tightening of the stop distance when stronger bearish reversal signals occur, including failed bounce attempts, lower highs, or clear resistance rejections. This level reduces the tolerance for further losses but still allows the trade to remain open if price stabilizes.
Extended Stop Loss Percentage Add-On: an additional percentage beyond the maximum loss cap, temporarily applied if strong bullish recovery signals appear.
In addition to these percentage-based stop adjustments, you can define instant exit rules that immediately close the position as soon as specific structural conditions are met. Unlike percentage-based stops, instant exits do not wait for further price movement or confirmation. They are typically used to react to decisive events such as a confirmed breakdown below support, a lower high after a failed bounce, or a sharp rejection at a resistance level. This combination of tightened stops and instant exit triggers allows for a flexible but disciplined approach to managing trades.
Pro Tip:
Most traders lose because their stops don’t evolve with the trade. Build a logic tree:
If trend = strong ➡ extend stop
If reversal risk ➡ tighten stop
If clear reversal signs ➡ exit
⸻
Disclaimer: This content is for educational purposes only and does not constitute financial advice. Please do your own research before making trading decisions.
DOGEUSDT trade ideas
DOGEUSDT - near support? Holds or not??#DOGEUSDT... market just reached near his supporting area even ultimate area. That is around 0.10 and current market price is around 0.15
If market holds current supporting area then we can expect a bounce from here.
Below 0.10 we will never see again bounce ... Note that.
Good luck
Trade wisely

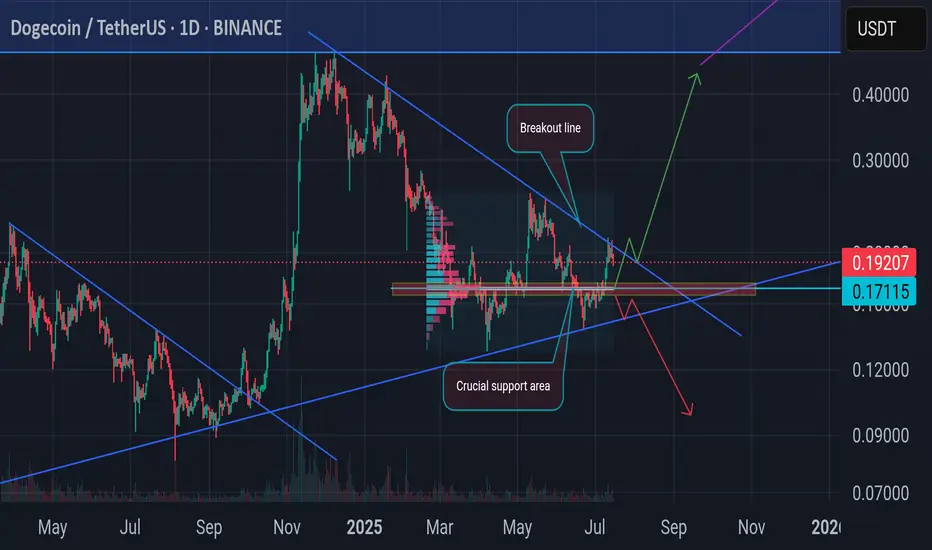
Fill your porto with DOGE :)Fill your portfolio with DOGE. DOGE's price structure 1D remains bullish. It would be impressive if it breaks through the breakout line.
⚠️ The $0.17115 support level is a crucial level to maintain, otherwise the price may decline further.
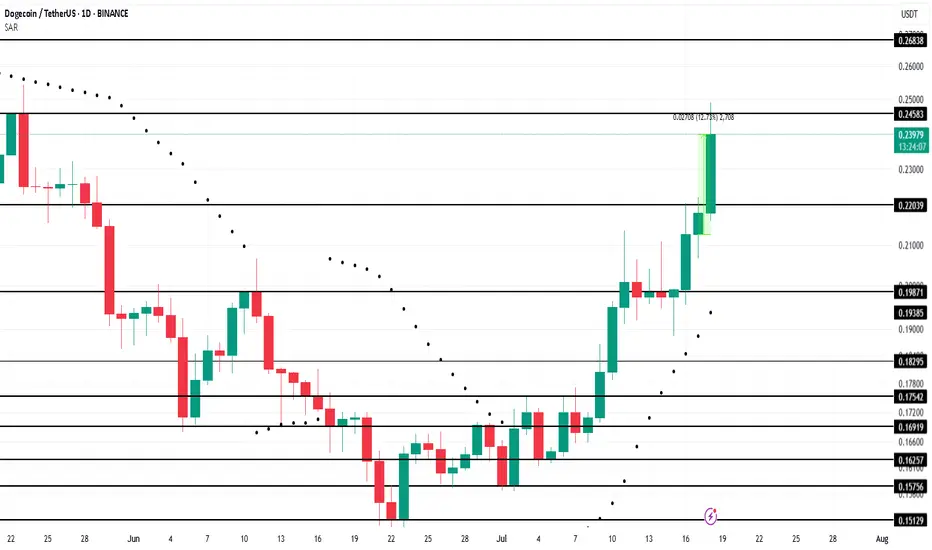
Dogecoin Leads Meme Coins With 12% Rally In 24 HoursBINANCE:DOGEUSDT , the leader of meme coins, surged 12% over the last 24 hours , reaching $0.239. This rally has positively impacted other meme tokens, showcasing DOGE’s influence within the market.
Currently facing resistance at $0.245, BINANCE:DOGEUSDT has reached a 2-month high . The Parabolic SAR below the candlesticks signals that DOGE is likely to maintain its upward trend in the coming days. If this support holds, the meme coin could continue pushing towards higher price levels, attracting more buyers and momentum.
However, meme coins are volatile. If BINANCE:DOGEUSDT holders decide to cash out their profits, the price could drop back down to $0.220 . Losing this support would invalidate the bullish outlook, signaling a possible downturn for the altcoin in the short term.
DOGE setting up a bullish Bull Flag?DOGE is moving within a descending channel after making a good run upside.
Current tend shows possibly setting up a bullish bull flag pattern. If breakout verified, DOGE will skyrocket to $0.25 range in coming days.

DOGE | Preparing for Breakout Dogecoin appears to be setting up for a potential breakout from a long consolidation phase.
Key Technical Signals:
- Price has been consolidating near the range low around $0.14260 for months
- Recent price action shows higher lows formation
- RSI is showing signs of life after extended oversold conditions
Potential Long Setup:
- Entry: Current levels around $0.18025 or on any dip to support
- Target: Range high at $0.45000 (150%+ potential gain)
- Stop Loss: Below $0.14260 support level
Risk Factors:
- Crypto markets remain volatile
- Bitcoin correlation could impact movement
The technical setup suggests accumulation at these levels, with the potential for a significant move if the diagonal resistance is broken. However, failure to hold current support could lead to further downside.

DO GE - Call the Ambulance!Okay DOGE thinks he is smart but he aint he will be taking hype and fall down and fall down in the place where no one can expect! Quasimodo in position!

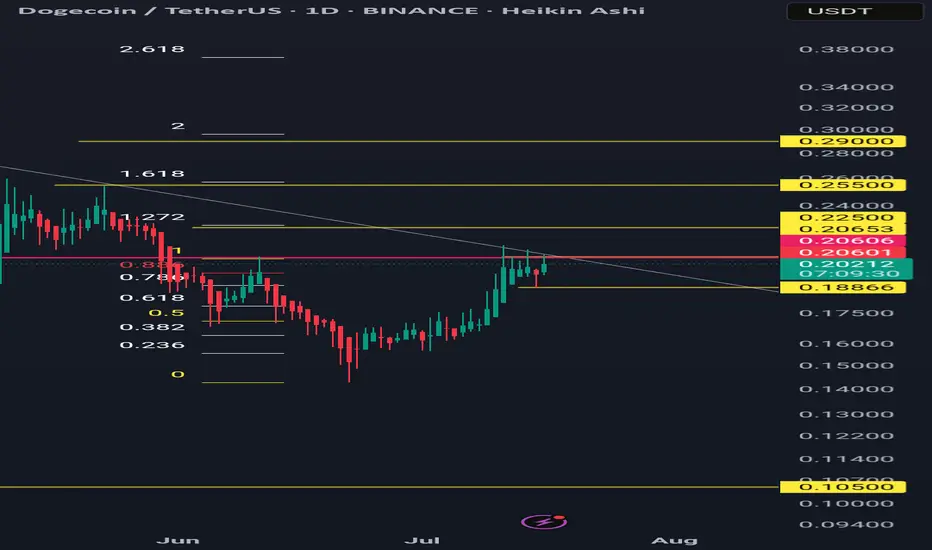
Dogeusdt bullish iH&S/cup&handle pattern in daily tfForming a bullish pattern and a close above 0.206 in daily time frame may activate the pattern.
Targets are 0.225, 0.255 and 0.29
Invalidation below 0.1886
DOGE Short SetupTight SL, 1:3 Risk-Reward.
We might go higher, but current key levels and price actions tells me to go short setup.

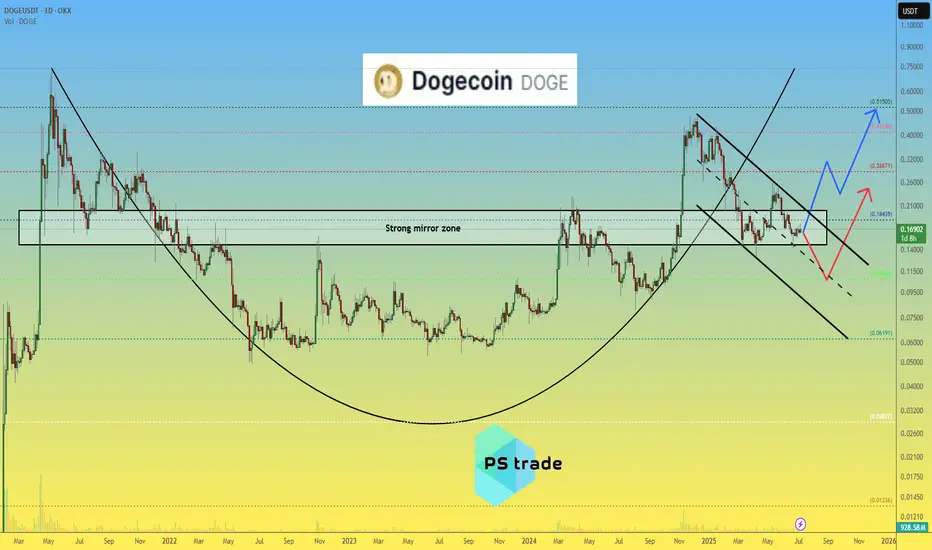
Dogecoin DOGE price analysisCRYPTOCAP:DOGE price is now in the middle of a strong mirror zone of $0.15-0.20
📈 It looks like the position is now accumulating, forming a "double bottom" and then, only a way for growth, to the highs in the region of $0.45-0.50
🐻 On the other hand, the scenario of another "leg" down fits perfectly into the TA canons. That is, it is very likely that if the price of OKX:DOGEUSDT drops below $0.15, then it is already fall to $0.10)
P.S.:
#Doge is an interesting asset, it is worth watching with one eye, and with the other eye, watch how the "battle" between Trump and Musk (who is the main influencer and "pumper" of #Dogecoin) will end.
💡 And then put the two pieces of information together and make a trading decision - "easy money" !)
_____________________
Did you like our analysis? Leave a comment, like, and follow to get more
doge buy midterm"🌟 Welcome to Golden Candle! 🌟
We're a team of 📈 passionate traders 📉 who love sharing our 🔍 technical analysis insights 🔎 with the TradingView community. 🌎
Our goal is to provide 💡 valuable perspectives 💡 on market trends and patterns, but 🚫 please note that our analyses are not intended as buy or sell recommendations. 🚫
Instead, they reflect our own 💭 personal attitudes and thoughts. 💭
Follow along and 📚 learn 📚 from our analyses! 📊💡"

DOGEUSDT UPDATE
Pattern: Falling Wedge Breakout
Current Price: \$0.24086
Target Price: \$0.4667
Target % Gain: 125.41%
Technical Analysis: DOGE has broken out of a falling wedge pattern on the 1D chart with strong bullish momentum and a +10.35% daily candle. The breakout is confirmed with increasing volume, suggesting continuation toward the target zone.
Time Frame: 1D
Risk Management Tip: Always use proper risk management.

DOGE/USDT Breakout Theft Plan| Smart Entry + Exit| Bullish Bias🐶💰 DOGE/USDT Master Heist Plan – The Bullish Breakout Robbery! 💸🔓
(Thief Trading Style – Steal Profits, Not Dreams)
🌟Hello, Hola, Ola, Bonjour, Hallo, Marhaba!🌟
To all the fearless Market Movers & Silent Operators out there – welcome to another strategic DOGE raid guided by technical precision and macro-level insight! 📈🧠
🔐 The Game Plan – Let’s Break the Bank!
This chart outlines our long-entry mission for DOGE/USDT, based on a unique Thief Trading Style strategy. The market currently shows bullish momentum, setting the stage for an upside breakout—but not without traps! Stay sharp.
💥 Key Concepts at Play:
Pullback Zones = Entry Points (Mark the lows, grab the loot)
ATR Line Zone = High-Risk Area (Time to plan your exit)
Reversal & Consolidation Zones = Watch for fakes & traps
News Events = Potential market detonators – keep your stop-loss close
📍Entry Point – "The Vault’s Open!"
💰 Plan A: Instant execution for those already prepped.
📉 Plan B: Place Buy Limit Orders near recent 15–30 min swing lows for a stealthier entry during pullbacks.
🚨Stop-Loss Setup – Safety First, Always
📍 Recommended SL: Near the 2H swing low (around 0.15500)
🛡️ Adjust based on your personal risk, account size, and trade volume. Thieves plan smart—never go in blind.
🎯Target – Clean the House and Vanish
🎯 Primary Target: 0.18500
⚠️ Exit early if market conditions shift. The first rule of the game? Don’t get greedy.
⚡Scalpers’ Mode – Hit & Run
Only trade LONG setups. Whether you’re a heavy hitter or playing it safe, stick with the bulls. Use trailing SL to protect the bag.
📊Why This Heist Works – Under the Hood
The DOGE/USDT setup is driven by:
✅ Bullish sentiment
✅ Fundamental trends
✅ Macro drivers
✅ On-chain activity & intermarket signals
✅ COT Reports & future momentum indicators
(For full breakdown, check linkkied data 👉🔗🔍)
📡News & Risk Management Reminder
🚫 Avoid opening fresh trades during high-volatility news events.
📉 Always trail your stop to secure profits during live positions.
Adapt fast – the market changes in a blink.
❤️Support The Plan
💥 Smash the Boost button to help spread the Thief Trading Style across the platform! Let’s make smart money together, one chart at a time. Every like, comment, and follow powers the next move. 💪💵🚀
🔔 More Heist Plans Coming Soon – Stay connected, stay dangerous... and stay profitable.
🐱👤Until then – Trade Smart. Trade Thief. Make Your Mark. 💸

More DOGE - More WOWThe most probable trade of the morning times from Masta Crypta! with small sl like a sling shot!


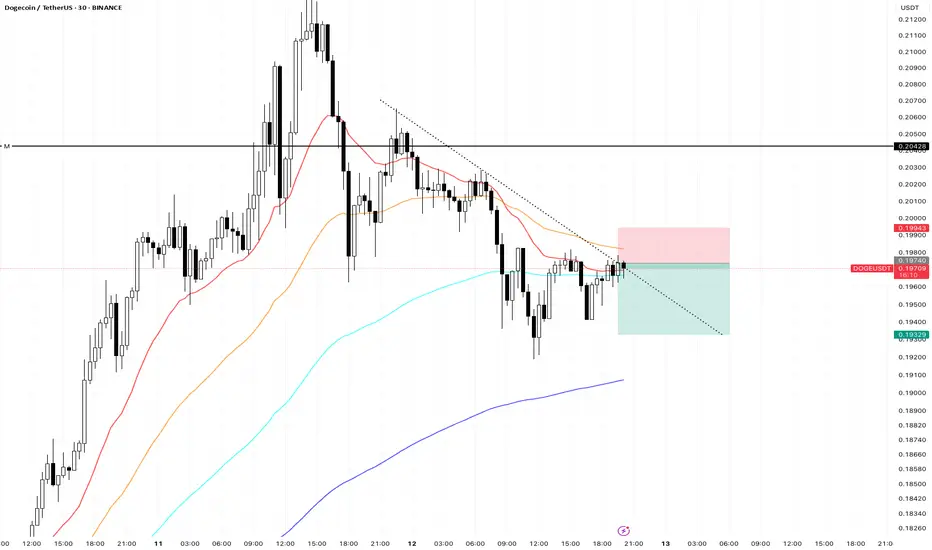
#DOGE/USDT Long Swing Setup #DOGE
The price is moving within a descending channel on the 1-hour frame, adhering well to it, and is on its way to breaking it strongly upwards and retesting it.
We have a bounce from the lower boundary of the descending channel, this support at 0.1660.
We have a downtrend on the RSI indicator that is about to break and retest, supporting the upside.
There is a key support area in green at 0.16200, which represents a strong basis for the upside.
Don't forget one simple thing: ease and capital.
When you reach the first target, save some money and then change your stop-loss order to an entry order.
For inquiries, please leave a comment.
We have a trend of stability above the Moving Average 100.
Entry price: 0.17120
First target: 0.17420
Second target: 0.17788
Third target: 0.18250
Don't forget one simple thing: ease and capital.
When you reach the first target, save some money and then change your stop-loss order to an entry order.
For inquiries, please leave a comment.
Thank you.

DOGE Long Swing Setup – Musk-Fueled Hype & Political BuzzElon Musk’s launch of the “America Party” is reigniting interest in his potential impact on crypto—especially Dogecoin. With his history of moving DOGE’s price, this political pivot could stir volatility and renewed upside. We’re watching for a dip into the $0.15–$0.16 zone for a possible long entry.
📌 Trade Setup:
• Entry Zone: $0.15 – $0.16
• Take Profit Targets:
o 🥇 $0.19 - $0.20
o 🥈 $0.23 – $0.24
• Stop Loss: Daily close below $0.13

Is DOGE About to Explode or Collapse?Yello Paradisers! Are you ready for what could be DOGE’s most explosive move in weeks? DOGEUSDT is currently developing a very interesting bullish setup that deserves attention.
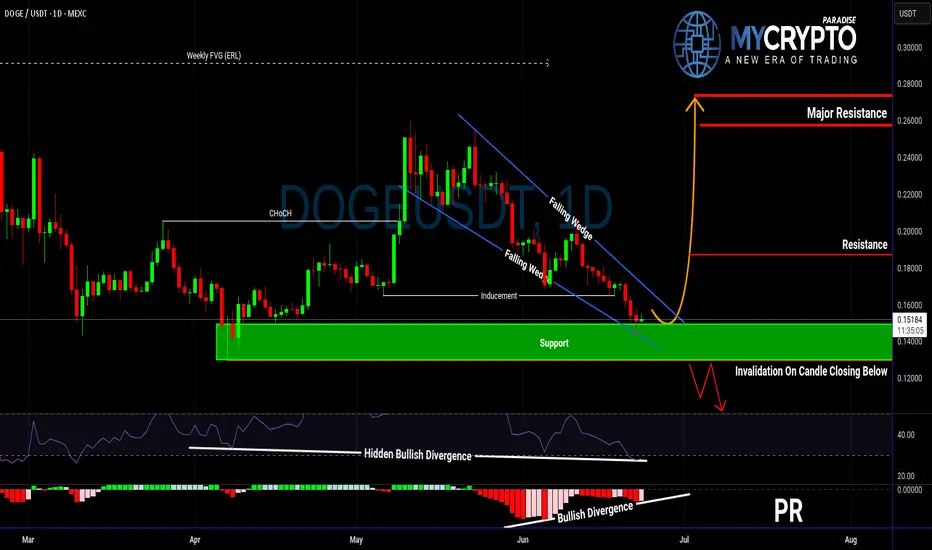
💎The pair has formed a falling wedge — a pattern that often precedes a breakout to the upside. This comes right after a confirmed bullish Change of Character (CHoCH), indicating that buyers are quietly stepping back in.
💎Even more important, we’ve seen a classic inducement grab, meaning early liquidity has been taken out, clearing the way for a potential real move. On top of that, there’s hidden bullish divergence on the RSI and clear bullish divergence on the MACD. This combination of signals significantly increases the probability of a bullish reversal from the current support zone.
💎If DOGE prints a convincing bullish candlestick pattern at these levels, it could offer a high-probability long opportunity with a strong risk-to-reward ratio. But be careful — if the price breaksdown and closes candle below this key support, the bullish scenario becomes invalid, and it’s better to wait for a more favorable structure to develop.
Strive for consistency, not quick profits. Treat the market as a businessman, not as a gambler. This is the only way you will make it far in your crypto trading journey. Be a PRO.
MyCryptoParadise
iFeel the success🌴
DOGE Presses Into Long-Term Trendline — Breakout or Breakdown?DOGE is approaching a multi-month descending trendline with rising volume and an overbought stochastic RSI. Price is coiling in a tight triangle just below both the 50 and 200 EMA — a major move is on deck.
🟢 Scenario 1 – Bullish:
Break above $0.18 and reclaim of the 200 EMA ($0.20) could launch DOGE toward $0.25+. A confirmed flip of the trendline would mark a major sentiment shift.
🔴 Scenario 2 – Bearish:
A rejection here and break below $0.16 could lead to a steep drop toward $0.12 or lower. The red path shows a return to the broader downtrend if bulls fail to step in.
⚠️ Stoch RSI is at extreme levels — suggesting the next move may come soon.

All market will face to fall!All markets are expected to decline, so the focus should be on short positions.

DOGE is stuck in the golden pocket... but for how long?📍Chart Breakdown:
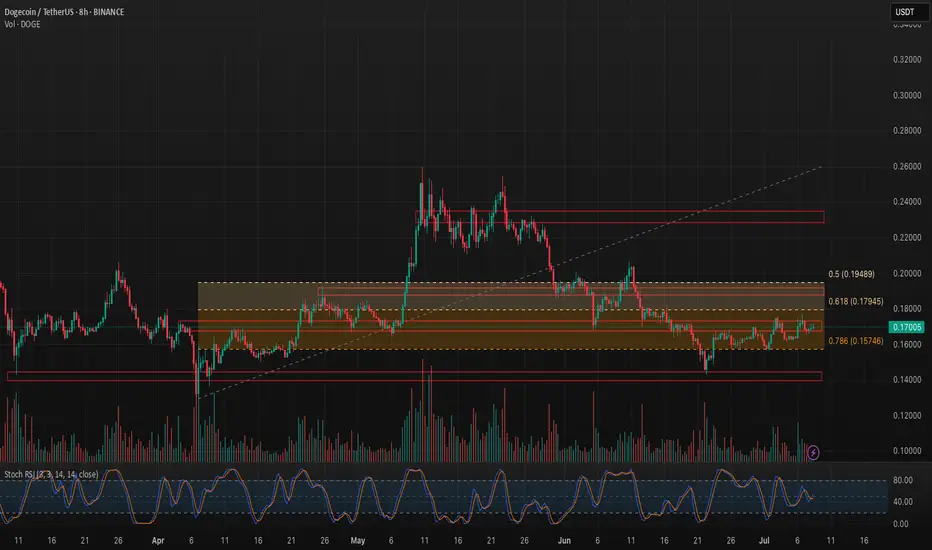
Dogecoin is consolidating within a key Fibonacci retracement zone, ranging between $0.158 and $0.178 — what traders often call the “golden pocket.” Price is coiling just above critical support.
🟡 Fibonacci Zone (Golden Pocket):
The $0.158–$0.178 area has acted as both resistance (early May) and support (mid-June onward).
Holding this range = potential bullish continuation.
Breaking below = likely retest of $0.14 or lower.
📉 Recent Context:
Sharp drop from the $0.22–$0.23 area in early June.
Since then, DOGE has been trying to base out in this fib zone.
Trendline support from April still loosely intact.
📊 Indicators:
Stoch RSI: Mid-range (53), turning up — could indicate a potential bounce or continuation higher.
Volume: Still muted — watch for spikes on breakout attempts.
🧠 Trade Scenarios:
Bullish: Break and close above $0.178 could retarget $0.20 and eventually $0.23.
Bearish: Breakdown of $0.158 with volume = high risk of drop to $0.14
Are you ready for New Miracle ? Doge is one of them#Gold #XAUUSD #PriceAction #Fibonacci #EMA50 #TradingView #Scalping #TrendTrading #LiquidityGrab #AltcoinsSpeakLouder #TradeWithMky
What happens when price dives, grabs liquidity, and kisses the 50 EMA with a bullish shadow candle?
You get what I call a "Miracle Shot" setup.
🔹 Price retraced deeply into a golden zone (between 50–61.8% Fibonacci).
🔹 The candle with a long lower wick shows liquidity grab.
🔹 Immediate bullish rejection right from the EMA50 = clear entry signal.
🎯 Entry: Near EMA50 + confirmation candle
🛑 SL: Below the shadow
✅ TP: Fibonacci extensions at 161%, 261%, and 414%
You can already see how price exploded after this textbook setup.
In the next move (second screenshot), price creates a wick to the upside—classic sign of profit-taking or potential trap for late buyers.
✍️ If price retests EMA50 again with a valid setup, this could be your Re-entry Shot.
