Dogecoin&USDTThe bullish DOGECOIN trend has closed in the short term, even in the medium term.
Most of the profit taking and at best the exit are activated.
"" However, Doge's ultimate goal is to break the $1 mark ""
DOGEUSDT_023B62 trade ideas

"DogeCoin" Crypto Heist - Bullish Breakout Plan!🌍 DOGEUSDT Crypto Heist Plan: Unleash the Thief Trading Style! 🤑💸🚀
Dear Market Mavericks & Crypto Bandits, 🏴☠️
Get ready to pull off the ultimate DOGEUSDT market heist with our Thief Trading Style, blending razor-sharp technical analysis and cunning fundamental insights! 📊🔥 Our mission? Storm the market, grab those bullish profits, and escape before the Dangerous Red Zone traps us in overbought chaos, consolidation, or a bearish reversal. 💥 Let’s outsmart the market and cash out like legends! 🏆🎉
📈 The Heist Blueprint: Long Entry Strategy
Entry Point 🚪:
The breakout is your signal! Wait for DOGEUSDT to smash through the Moving Average (MA) at 0.28000—that’s your green light for bullish glory! 🌟
Pro Tip:
Set Buy Stop Orders just above the MA for breakout confirmation.
OR place Buy Limit Orders at the most recent 15M/30M swing low/high for pullback entries.
Set an ALERT on your chart to catch the breakout in action! 🔔
Stop Loss (SL) 🛑:
Breakout traders: Hold off on setting your SL until the breakout confirms. Place it at the recent 1D swing low (0.2000) for swing/day trades.
Risk Management: Adjust SL based on your lot size, risk tolerance, and multiple orders. Play it smart—this is your safety net! ⚠️
Rebels beware: If you stray from the plan, you’re dancing with fire. Own the risk! 🔥
Take Profit (TP) 🎯:
Aim for 0.42000 — our golden exit.
Escape Plan: If the market screams overbought or shows reversal signs, get out early! Don’t get caught in the Red Zone trap. 🚨
🧲 Scalpers’ Corner 👀
Scalp LONG only—ride the bullish waves! 🌊
Got big capital? Dive in now. Smaller stack? Join the swing traders for the full heist.
Use Trailing Stop-Loss to lock in gains and protect your loot. 💰
📡 Market Pulse: Why DOGEUSDT?
The DOGEUSDT market is in a neutral trend with a high probability of bullish momentum. Here’s the intel driving our heist:
Fundamentals: Dive into macroeconomic data, COT reports, geopolitical events, and news sentiment.
Intermarket Analysis: Watch correlated assets for clues.
Seasonal & Positioning Trends: Align with the market’s rhythm.
Future Targets: Check the Overall Score for a full breakdown! 👉🌏🔗
⚠️ Trading Alert: News & Risk Management 📰
News releases can flip the market like a switch! Protect your positions:
Avoid new trades during high-impact news.
Use Trailing SL to secure profits and minimize losses.
Stay sharp—volatility is our friend, but only if we’re prepared!
💪 Join the Heist & Boost the Plan!
Hit the Boost Button to supercharge our Thief Trading Style and make this heist legendary! 🚀 Every boost strengthens our crew, helping us plunder profits daily with ease. 💥 Let’s dominate the DOGEUSDT market together! 🤝
Stay tuned for the next heist plan! 🐱👤 Keep your charts locked, your alerts set, and your trading spirit wild. See you in the profits, bandits! 🤑🎉
#ThiefTrading #DOGEUSD #CryptoHeist #TradingView #MakeMoney

Is DOGE ready to pump 20% toward $0.22 next?Hello and greetings to all the crypto enthusiasts, ✌
All previous targets were nailed ✅! Now, let’s dive into a full analysis of the upcoming price potential for Dogecoin 🔍📈.
DOGE is showing strong signs of an imminent breakout above the descending channel resistance. A confirmed breakout could open the door for a potential +20% move, with the next key target around $0.22, aligning with a major supply zone 📈. Watching for volume confirmation and momentum strength on lower timeframes 🚀.
🧨 Our team's main opinion is: 🧨
DOGE is gearing up for a strong breakout above its descending channel, with a 20% upside potential and a key target at $0.22 if momentum confirms 📊.
Give me some energy !!
✨We invest hours crafting valuable ideas, and your support means everything—feel free to ask questions in the comments! 😊💬
Cheers, Mad Whale. 🐋

DOGECOIN. USDT Hello, crypto traders.
In my opinion, we have the first scenario, that is, a correction, and then a rally in Doge.
What do you think?
first scenario or second scenario!!!????

DOGE Warming Up for a Major Rally?
Dogecoin has bounced strongly off the $0.14 support and is showing signs of a bullish reversal on the weekly timeframe. If momentum holds, a breakout toward $1.00 could be in play. Watch for volume confirmation and follow-through in the coming weeks – DOGE might just be gearing up for another historic run.

DOGE - 1$ NextDoge is getting ready for the next wave. Based on the previous trend we are looking at the next target around 1.1$.
Doge can break 1$ easily based on the current trend and overall interested in DOGE.
Entry: 0.1766
TP1: 0.22086
TP2: 0.30439
TP3: 0.40104
TP4: 0.53436
TP5: 1.13587
Stop Loss: 0.1143
Follow us for more such ideas.
Cheers
GreenCrypto

DOGECOIN TO TEST A NEW ATH THIS CYCLEGood afternoon everyone!
I think dogecoin, supported by its resilient and much wow global community, is on a bulish track that will reach the ATH in this cycle! Price discovery may be completely crazy after reaching 1$, who knows?!
This is my first chart, so I am sorry for potential mistakes!
Please, share your opinion :)


Will Dogecoin hit $0.225 after a 25% channel breakout?Hello and greetings to all the crypto enthusiasts, ✌
All previous targets were nailed ✅! Now, let’s dive into a full analysis of the upcoming price potential for Dogecoin 🔍📈.
Dogecoin remains a favorite in my portfolio, and I successfully locked in profits by selling near recent highs. After re-entering at the $0.14 level, I'm anticipating a short-term gain of at least 40%. This setup is based on a 25% move toward a potential breakout above the descending channel, with a key target at $0.225.📚🙌
🧨 Our team's main opinion is: 🧨
Sold Dogecoin at the top, re-entered at $0.14, aiming for a short-term target of $0.225, with 40% gain for longer-term.📚🎇
Give me some energy !!
✨We invest hours crafting valuable ideas, and your support means everything—feel free to ask questions in the comments! 😊💬
Cheers, Mad Whale. 🐋

Is Dogecoin gearing up for a breakout toward $0.18?Hello and greetings to all the crypto enthusiasts, ✌
All previous targets were nailed ✅! Now, let’s dive into a full analysis of the upcoming price potential for Dogecoin 🔍📈.
Dogecoin is nearing a key support level that has historically provided strong price stability.
A short-term rebound of at least 20% is likely, with potential upside targeting the $0.18 resistance zone. This level marks a significant barrier and could shape the next major price direction.📚🙌
🧨 Our team's main opinion is: 🧨
Dogecoin is bouncing off a key support and could see a quick 20% rally toward the major $0.18 resistance, which might decide its next big move.📚🎇
Give me some energy !!
✨We invest hours crafting valuable ideas, and your support means everything—feel free to ask questions in the comments! 😊💬
Cheers, Mad Whale. 🐋

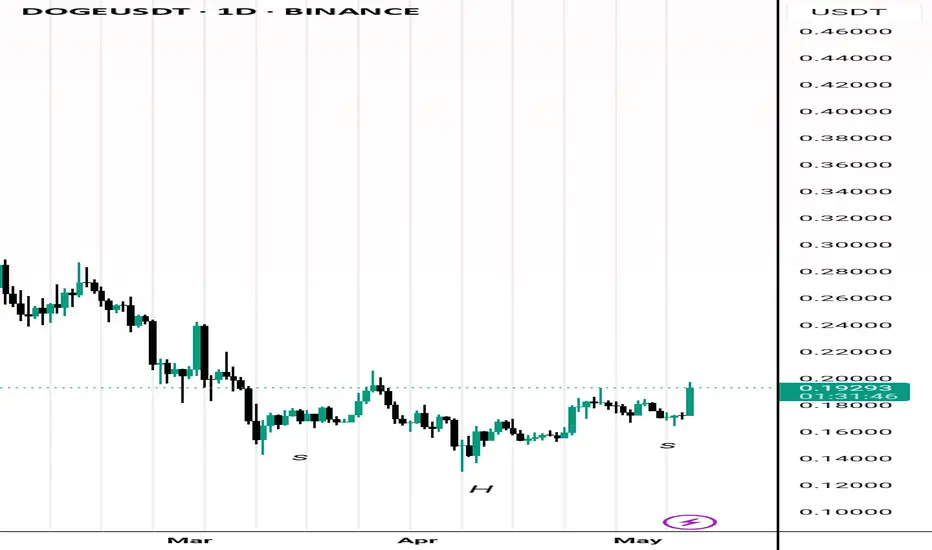
"DOGE Analysis" (Update)the price can form a head and shoulders pattern. If that is happen, expect a significant price increase.
Stay Awesome , CobraVanguard

DOGE Finds Support Near 0.1700DOGE Finds Support Near 0.1700
DOGE has successfully hit both of our previous targets, with 0.1925 proving to be a strong resistance level. Following this, the price pulled back in a correction and is now testing a key support area near 0.1700.
If DOGE holds above this level, there's a good chance the bullish trend could resume. However, the current challenge is the low trading volume, which increases risk for this setup.
You may find more details in the chart!
Thank you and Good Luck!
❤️PS: Please support with a like or comment if you find this analysis useful for your trading day❤️

DOGE Breakout alertDOGE Successfully breakout this resistant line
Expect can pump more from here with short term target 10%
Invalid if daily candle close below 0.153

Doge Buy Idea If you miss out of the BTC trade idea, you can still position yourself for Doge longs.
LONG DOGE/USDT | Falling Wedge ⇒ Bullish ReversalDOGE/USDT | Falling Wedge ⇒ Bullish Reversal
If you recall my April 3 prediction to go long on DOGE/USDT at 0.13210, the pair bounced precisely at that level, surged 48%, and reached its second target on the daily timeframe.
We are now reassessing our setups to position for a second leg up.
📊 Market Structure
Pattern: Price has been compressing into a falling wedge, marked by lower highs and lower lows converging (blue lines).
🔹 Demand Order Block
Zone: 0.160 – 0.164 USDT (shaded blue)
0.16360 USDT – trend-line support test
0.16360 USDT – prior swing base
⚔️ Long Entry Strategies
Enter on a bounce off 0.16360 USDT with a bullish rejection/ retest.
🛑 Stop Loss
A close below the Level: 0.15580 USDT
Placed just below the demand block to absorb noise while capping downside.
🎯 Profit Targets
Target Price (USDT)
TP1 0.17123
TP2 0.18077
TP3 0.19296
🔧 Trade Management
Scale Out: Take partial profits at each TP to lock in gains.
Trail Stop: Move to breakeven after TP1 is reached.
Invalidation: A close below 0.15580 USDT negates the setup—exit and reassess.

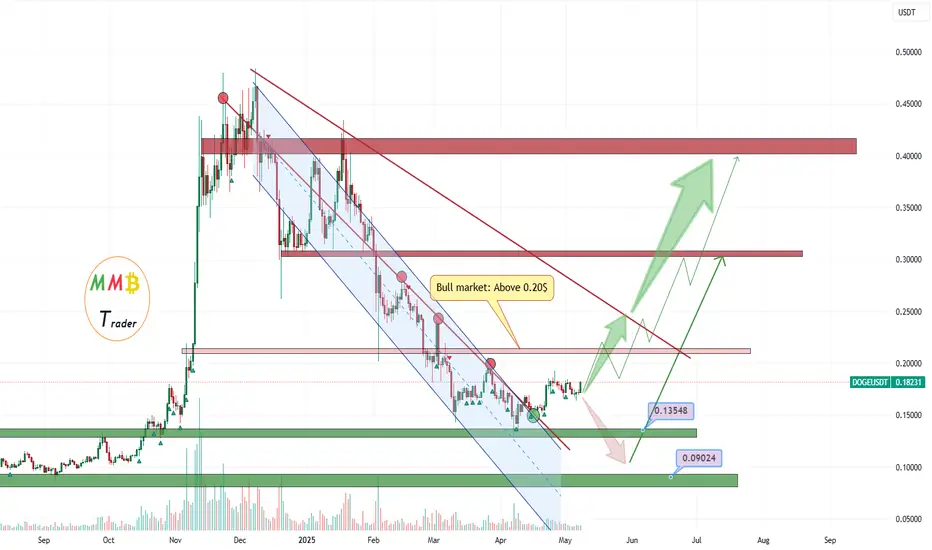
DOGEUSDT Heavy gain is ahead As we said before so many resistances broke in last weeks also price was range here near major resistance of 0.20$ and soon it will break this resistance and soon after that heavy pump will lead here to the next targets which are mentioned on the chart.
DISCLAIMER: ((trade based on your own decision))
<<press like👍 if you enjoy💚
Lingrid | DOGEUSDT classic Continuation PATTERN UnfoldingThe price perfectly fulfilled my last idea . BINANCE:DOGEUSDT is attempting a recovery after rebounding off the ascending trendline and breaking out of a falling wedge formation. Price is now retesting the breakout level near $0.175 with a higher low structure still intact. Buyers are watching closely for continuation toward the next resistance area.
📌 Key Levels
Support zone: 0.17509 (wedge breakout and trendline intersection)
Breakout target: 0.19000 (top of prior range and midpoint of resistance area)
Invalidation level: below 0.17509 with strong candle close
⚠️ Risks
Pullback failure to hold 0.175 could trigger a drop to the broader support level
Overhead resistance at 0.190 and 0.200 may slow upward momentum
Market indecision if volume fades near the wedge apex
Traders, if you liked this idea or if you have your own opinion about it, write in the comments. I will be glad 👩💻

DOGE Bulls Wake Up ! Major Breakout Setup You Shouldn’t Miss Hello Traders 🐺
Hope you're doing well!
We’re back with another idea — this time a clean trade setup on DOGE, so make sure to read this one all the way through 👇
As you can see on the chart, price is currently breaking above the descending channel, which forms our falling wedge resistance line — a bullish signal so far. But we need to pay close attention to the next key resistance area around $0.19460, which lines up with the previous high and the red resistance zone.
🔹 So, What’s the Plan?
You’ve got two solid options:
✅ Wait for confirmation.
Look for a clear breakout and at least two 4H candles closing above the resistance line. If price then retests that line as new support, it’s a good spot to enter a long position.
🎯 Stop-loss: Just below the current low at $0.12500
🎯 Target: The top of the wedge — which makes sense, since it also lines up with a heavy resistance zone.
📌 Don’t forget to take partial profits near the top and move your stop-loss to breakeven to secure the trade!
And as always, remember our golden rule:
🐺 Discipline is rarely enjoyable, but almost always profitable. 🐺
🐺 KIU_COIN 🐺

Doge Trade!!!Doge broke out of a Huge Falling Wedge and now is getting ready to move to the upside
I think is a good time to accumulate or enter a long position with low leverage.
DYOR

$DOGE Consolidating - Q3 will be big!Would love to see another retest into the 15c zone—might be asking for a lot, but if it happens, I’ll be ready.
If not, expecting a move toward 22c before any significant retrace.
Looks like it’s setting up for some consolidation, with major expansion likely in July as the new quarter kicks off CRYPTOCAP:DOGE $DOGESUSDT
doge buy midterm "🌟 Welcome to Golden Candle! 🌟
We're a team of 📈 passionate traders 📉 who love sharing our 🔍 technical analysis insights 🔎 with the TradingView community. 🌎
Our goal is to provide 💡 valuable perspectives 💡 on market trends and patterns, but 🚫 please note that our analyses are not intended as buy or sell recommendations. 🚫
Instead, they reflect our own 💭 personal attitudes and thoughts. 💭
Follow along and 📚 learn 📚 from our analyses! 📊💡"

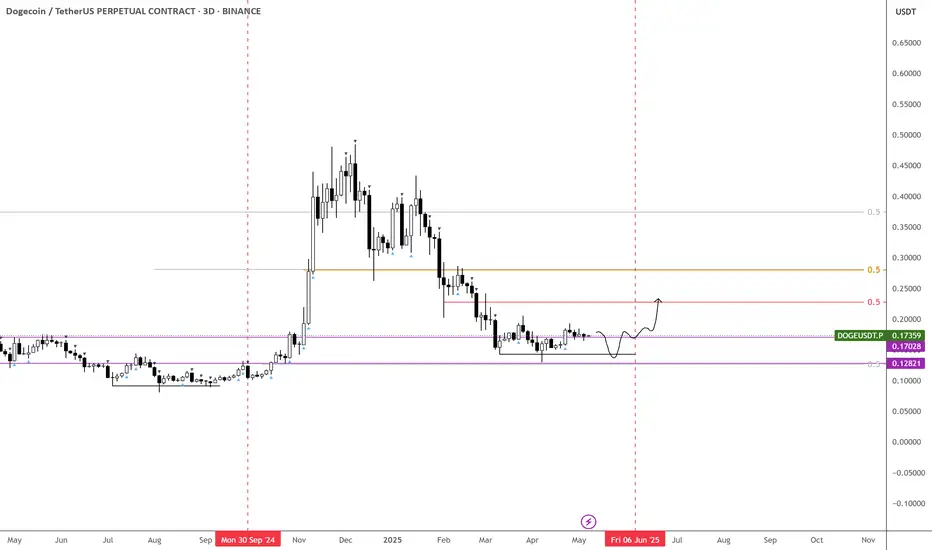
Dogecoin is not ready for a big growth...The equilibrium analysis of the 3-hour chart of Dogecoin from two major peaks (December 2024 and January 2025) tells us that the main equilibrium zone of both major trends has been broken in this timeframe and in the medium term the candles will move towards the middle zone of these two major trends... In the medium term the downside targets of 0.10 and 0.07 will be touched... Fundamental news or the game of whales may be able to cause a slight delay in the equilibrium path of the chart, but ultimately the candles will move towards the mentioned downside targets.
Note: Equilibrium analyses look at the chart on a large scale and in a macro way... We may be delayed in reaching the target, but the targets will be touched...

Long trade
5min TF ovewrview
📘 Trade Journal Entry
DOGEUSDT (Buy Side)
🗓 Date: Monday, 5th May 2025
⏰ Time: 12:00 PM
📍 Session: London to New York PM Transition
🪙 Pair: DOGE/USDT
📈 Direction: Long (Buy Side)
🔹 Entry Details:
Entry Price: 0.16894
Take Profit: 0.17375 (+2.85%)
Stop Loss: 0.16884 (−0.06%)
Risk-Reward Ratio: 48.1
🔹 Trade Context:
Executed during the London–New York PM crossover, often a key window for major intraday reversals or trend continuations. Market structure showed a series of higher highs, confirming bullish intent and sustained buyside pressure.
