DOGE Short Term pullback prior to breaking trendI am bearish on Dogecoin for the next 10 days or so, but overall bullish to break the downward trend for months now.
Waiting for a break above the longterm downward then a retest would be the safest play. A more aggresive approach may be to put some orders in at the recent support levels with a stop loss near the recent lows.
Doge is a popular token and meme that has a large following. I think there are many long term holders than any other meme.
DOGEUSDT_023B62 trade ideas

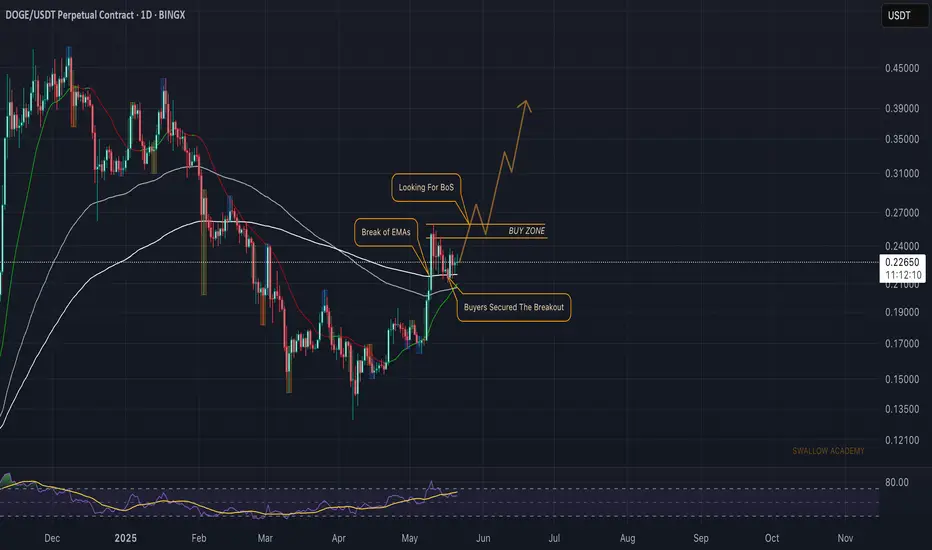
Dogecoin (DOGE): Breakout From EMAs + Successful Re-Test | BOS?Dogecoin had recently broken the lines of EMAss (100 & 200), where, after a successful retest, buyers took over the area and now are heading towards the Break of Structure Area.
Once we get the BOS, we will be looking for a long position near this area, so we wait for now...
Swallow Academy
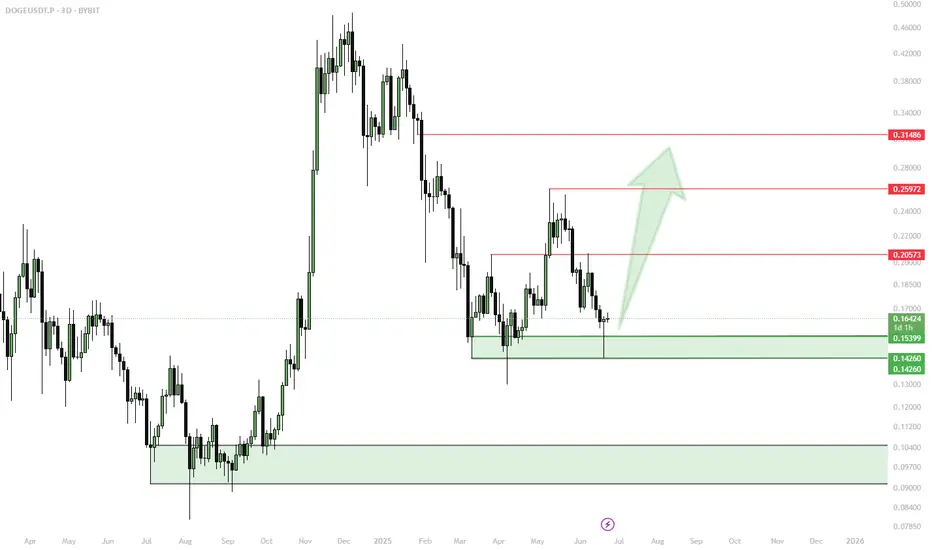
DOGE Forming a Bottom — Risk/Reward Favor Bulls✅ DOGE looks “forgotten” — minimal interest, low volume, no panic selling
✅ Bottoming structure forming; bounce from key support, retest of lows possible
✅ Accumulation only via spot limit orders in green zones; avoid market buys
⚠️ No expectations of breaking ATH, targets capped at $0.31–0.38
1. Bullish Scenario (~55%)
Retest of support zones ($0.143–0.16), spot accumulation
Trigger: Bounce on volume, reclaim of previous quarterly levels
Partial profit: $0.25; main targets: $0.31–0.38
2. Sideways Scenario (~35%)
Consolidation between $0.14–0.18, low volume, slow accumulation
Work the range: accumulate at lows, trim on spikes, patience
3. Bearish Scenario (~10%)
Break below $0.14 with no demand, deeper altcoin market correction
Stop loss on close under $0.14, wait for new supports — no averaging down without buy signals
📝 Order Management & Recommendations:
Place spot limit orders only in $0.143–0.16 and lower green zones
No market FOMO entries
First take-profit: $0.25; main TP: $0.31–0.38
Hard stop/loss under $0.14; no holding through breakdowns
DOGE ANALYSIS (12H)Based on the current available data, it appears that Dogecoin has entered a bullish phase after completing the diametric pattern marked on the chart. We are currently in wave B of this bullish phase.
Wave B may complete within the green zone, which is a key support area.
The targets for wave C have been marked on the chart.
A daily candle closing below the invalidation level would negate this outlook.
For risk management, please don't forget stop loss and capital management
Comment if you have any questions
Thank You

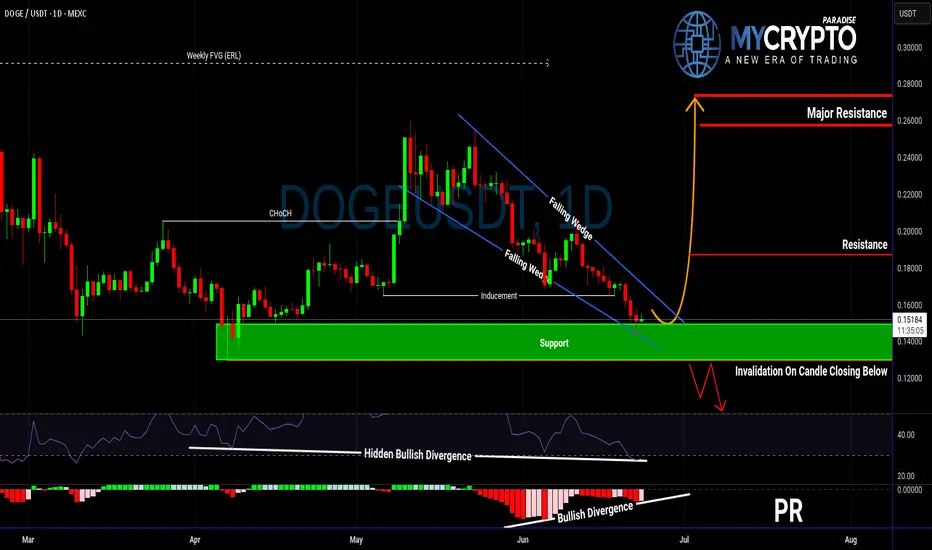
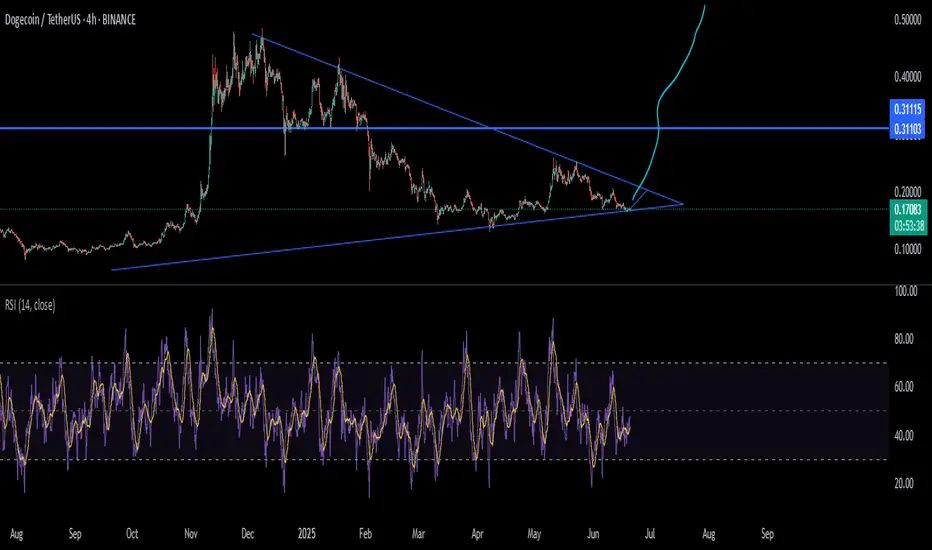
Is DOGE About to Explode or Collapse?Yello Paradisers! Are you ready for what could be DOGE’s most explosive move in weeks? DOGEUSDT is currently developing a very interesting bullish setup that deserves attention.
💎The pair has formed a falling wedge — a pattern that often precedes a breakout to the upside. This comes right after a confirmed bullish Change of Character (CHoCH), indicating that buyers are quietly stepping back in.
💎Even more important, we’ve seen a classic inducement grab, meaning early liquidity has been taken out, clearing the way for a potential real move. On top of that, there’s hidden bullish divergence on the RSI and clear bullish divergence on the MACD. This combination of signals significantly increases the probability of a bullish reversal from the current support zone.
💎If DOGE prints a convincing bullish candlestick pattern at these levels, it could offer a high-probability long opportunity with a strong risk-to-reward ratio. But be careful — if the price breaksdown and closes candle below this key support, the bullish scenario becomes invalid, and it’s better to wait for a more favorable structure to develop.
Strive for consistency, not quick profits. Treat the market as a businessman, not as a gambler. This is the only way you will make it far in your crypto trading journey. Be a PRO.
MyCryptoParadise
iFeel the success🌴
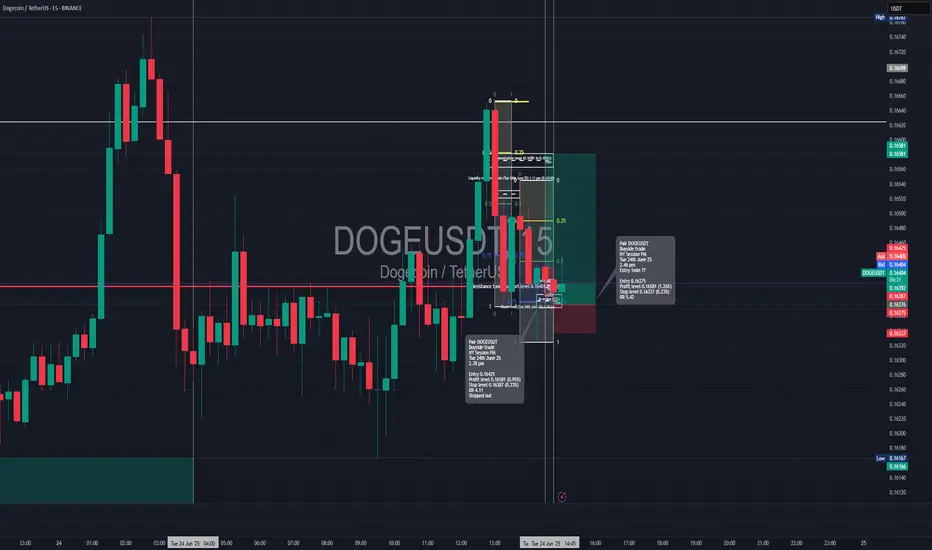
Long trade
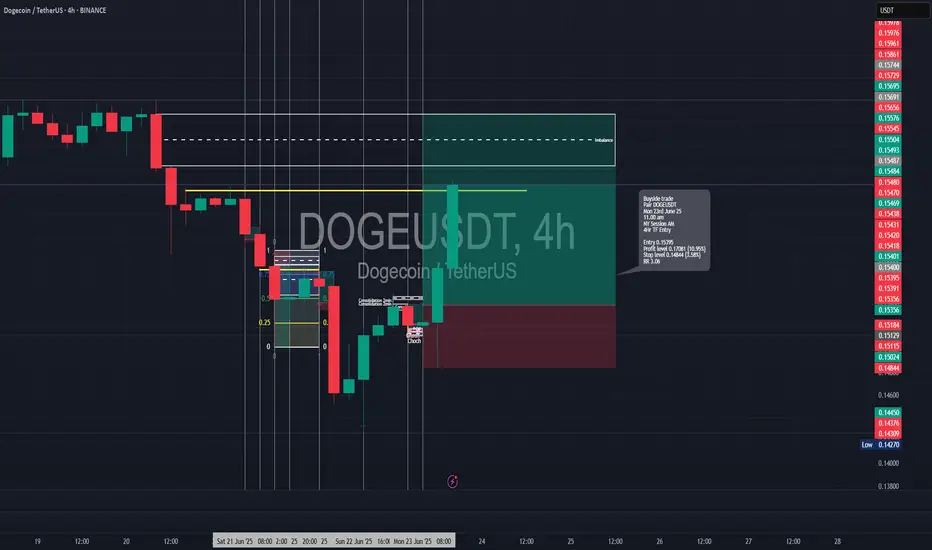
🟢 Trade Journal Entry – Buyside Trade
📍 Pair: DOGEUSDT
📅 Date: Monday, June 23, 2025
🕒 Time: 11:00 AM (NY Session AM)
⏱ Time Frame: 4 Hour
📈 Direction: Buyside
📊 Trade Breakdown:
Metric Value
Entry Price 0.15395
Profit Level 0.17081 (+10.95%)
Stop Loss 0.14844 (−3.58%)
Risk-Reward
Ratio 3.06 : 1
🧠 Context / Trade Notes:
4H Order Block Execution:
Entry triggered at the retest of a 4-hour bullish order block following price rejection and a bullish engulfing structure.
Long trade
📍 Pair: DOGEUSDT
📅 Date: Tuesday, June 24th, 2025
📈 Direction: Buyside
TIME: 2.45 PM (NY time)
NY Session PM
📊 Trade Breakdown:
Metric
Entry Price 0.16375
Profit Level 0.16581 (+1.26%)
Stop Loss 0.16337 (−0.23%)
Risk-Reward
Ratio 5.42: 1
🧠 Context / Trade Notes – ICT Inversion FVG Model
Fair Value Gap (FVG): The trade was executed based on ICT’s Inversion FVG model, where a previously bearish FVG was broken to the upside and then revisited as a bullish support zone.
🔍 Liquidity Sweep + Displacement:
Price swept a short-term sell-side low, triggering stops before sharply displacing upward, forming a bullish break in market structure and the FVG.
1min TF Entry
A huge reversal for DOGE!#DOGE finally found the bottom and currently forming bullish inverse head and shoulder pattern. It may continue to form a multiple bigger inverse head and shoulder pattern as it bounces up.
A short term price target appears to be around $0.20 if these patterns materialize.

DOGE wait for entry
DOGE has been consolidating within the \$0.13–\$0.25 range for the past four months.
Wait for price to approach the area of interest, where the range support aligns with the weekly trendline—forming a strong confluence zone for a potential entry.
Disclaimer:
This analysis is based on my personnal views and is not a financial advice. Risk is under your control.

Doge Long SetupDoge has successfully changed it's downtrend to uptrend with heavy volume, Waiting for a potential retest at 0.1590 area then we are good to go towards our MASSIVE target in the coming days.
DOGE Free Call
Longing Now: 0.1590 - 0.1640
Tp: 0.1980
Sl: 0.13445
It will take few days to fully play out.
Do your own research before taking any entry.

Strong support found on DOGEDOGE/USDT is currently at a critical suppot This level is likely going to hold and push price higher... The daily also aligns with it .
My target is 0.1616
SL is 0.1405

A time for rebound? Doge just hit the bottom of the descending channel and a rising blue support line.
It’s time for a rebound to the upper channel area.

Bullish trend continues for DogeDogeUSDT still going upwards. Trading in complex zone currently. Lots of liquidity bw 0.15154 and 0.15364. Heading towards 0.15364. Will probably retest 0.15154 before a breakout towards 0.15565.
#dogetothemoon #futuretrading

DOGEUSDT - near support? Holds or not??#DOGEUSDT... market just reached near his supporting area even ultimate area. That is around 0.10 and current market price is around 0.15
If market holds current supporting area then we can expect a bounce from here.
Below 0.10 we will never see again bounce ... Note that.
Good luck
Trade wisely

DOGE: Not looking good.Hello Traders,
Today, let’s analyze DOGE on the weekly timeframe.
DOGE isn’t looking very strong at the moment. The price has once again dropped back to the same level from which it rebounded a couple of weeks ago. It’s uncertain whether we’ll see another rebound from this point — but if it does, then great!
However, if market sentiment turns bearish, DOGE could potentially drop to around $0.06. So, stay cautious and trade safely.
Not financial advice.

Update on DOGE chart after Apr 7th heavy bleeding🔮 Short-Term Forecast (1–7 Days)
🧱 Base Case Scenario (Most Likely — 60% probability)
If DOGE holds above $0.14, builds support and gradually climbs toward $0.155–$0.16.
Could form a mini bull flag or W-bottom on the 4H/daily.
RSI levels will normalize in the 50–60 zone. This sets up a second leg of recovery — possibly to $0.165–$0.172. ((This is most likely if BTC stays above $72K+ and consolidates.))
🐻 Bearish Continuation (20% probability)
If DOGE rejects from $0.15–$0.155, forms lower high, and BTC breaks back down to test FWB:67K or $65K. In that case, DOGE can retest $0.13 or even wick into the $0.12s. Possible liquidation traps below $0.13.
Monitor BTC dominance: if it spikes, alts like DOGE suffer more.
🚀 Bullish Breakout (20% probability)
If BTC reclaims $80K and surges toward ATH ($85K+), DOGE could: Break above $0.165 and push quickly to $0.18–$0.19. Reignite interest and flip the trend.
📈 Levels to watch
Price Action Reason
$0.14–0.145 Watch support If it holds = accumulation zone
$0.172–0.18 Strong resistance Reclaim = full trend reversal confirmed
🧘♂️ Psychological Edge
The Fear Index was at 17: Usually marks bottoms, not tops.
RSI recovery = healthy reversal start.
High volume + strong candle = whales likely already bought.

DOGE LONG- DIvergence price with stoch
- price at demand area
- BTC possible break out
- stoch W and M oversold


friday backside of the week, continues the reversal thursday was first red day and a false break after 4 days of breakout. hopefully it is quick. not going to move anything after this, let it play out, no more mistakes

DOGE NEED A MIRACLE RIGHT NOW!!Hello again everyone, this is my first post again a while..
I want to share my prediction again about CRYPTOCAP:DOGE this week, because there is a lot of negative sentiment right now.. my point of view, there is too much pressure to sell alt coins.. not only CRYPTOCAP:DOGE but another alt coin in bearish right now..
There only a few coins, that I can suggest to you all.. First coins is CRYPTOCAP:BNB and $BTC.. that's all what I thought.. Good luck everyone..
DYOR!!

A time for a rebound? Doge just hit the bottom of the yellow descending channel and a rising blue support line.
Will the doge rebound to the upper channel area in coming days?

DOGE - At heavy volume rangeDOGE - At heavy volume range!
DOGE is at the heavy volume range on VRVP.
Great time to buy IMO.
