#DOGE/USDT Long Swing Setup #DOGE
The price is moving within a descending channel on the 1-hour frame, adhering well to it, and is on its way to breaking it strongly upwards and retesting it.
We have a bounce from the lower boundary of the descending channel, this support at 0.1660.
We have a downtrend on the RSI indicator that is about to break and retest, supporting the upside.
There is a key support area in green at 0.16200, which represents a strong basis for the upside.
Don't forget one simple thing: ease and capital.
When you reach the first target, save some money and then change your stop-loss order to an entry order.
For inquiries, please leave a comment.
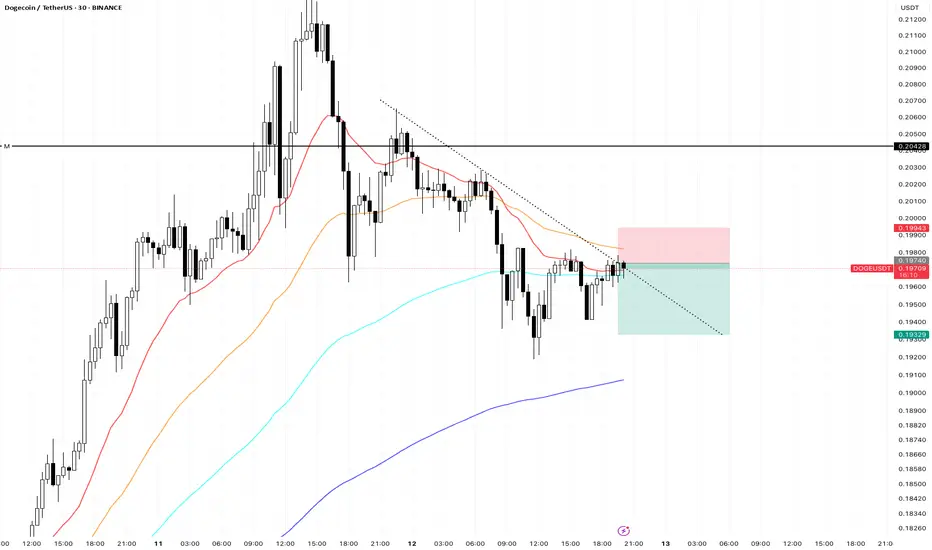
We have a trend of stability above the Moving Average 100.
Entry price: 0.17120
First target: 0.17420
Second target: 0.17788
Third target: 0.18250
Don't forget one simple thing: ease and capital.
When you reach the first target, save some money and then change your stop-loss order to an entry order.
For inquiries, please leave a comment.
Thank you.
DOGEUSDT_FCD13E trade ideas

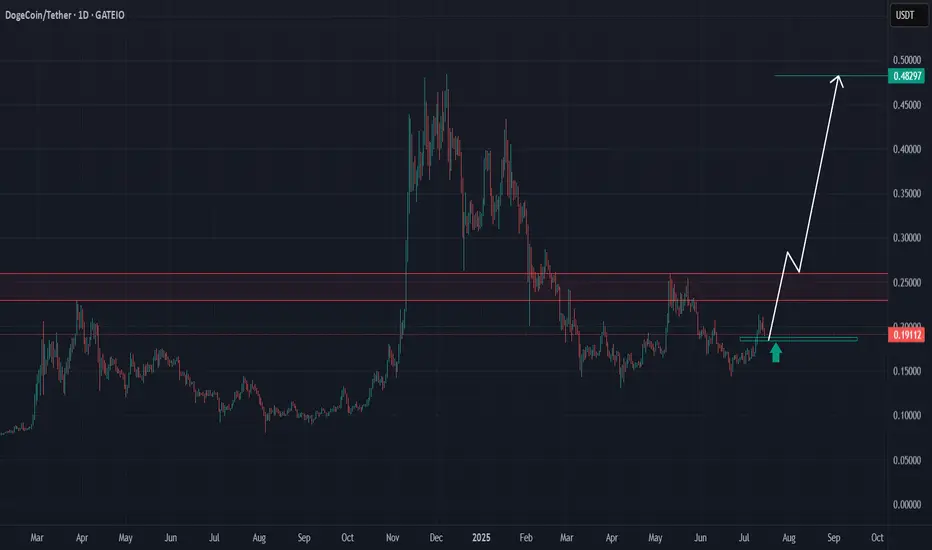
Dogecoin at a Key Turning PointDogecoin is now sitting around $0.19, inside a green zone on the chart where buyers are expected to step in.
The price is starting to move up from here, heading toward the red zone between $0.23 and $0.26 . This red area is where sellers were active before, so it’s an important level to watch.
- If Dogecoin can break above this red zone with strong buying volume , it could aim for the previous high around $0.48.
- If it struggles to move past this level, it may mean that whales are still selling, and the price could fall back down toward $0.08.
COINBASE:DOGEUSD BINANCE:DOGEUSDT BYBIT:DOGEUSDT BINANCE:DOGEUSDT.P
More DOGE - More WOWThe most probable trade of the morning times from Masta Crypta! with small sl like a sling shot!

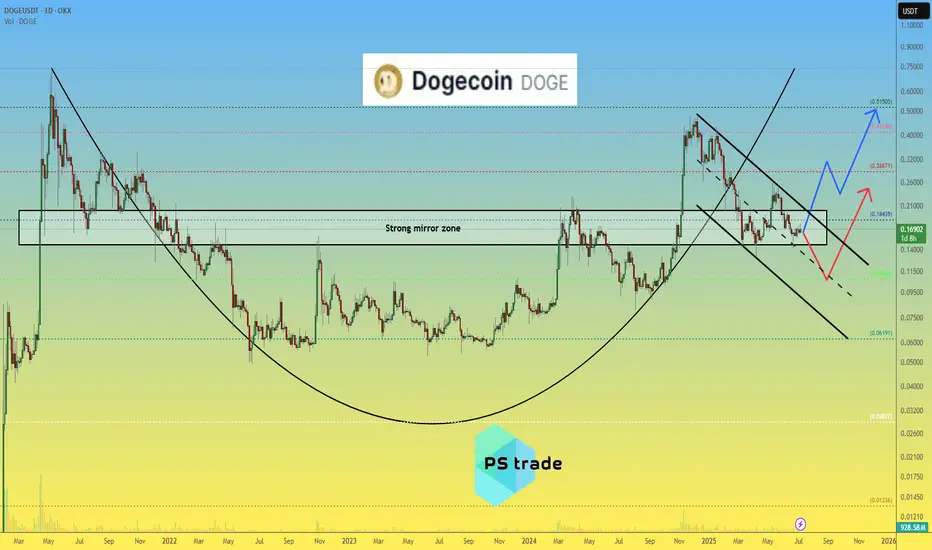
Dogecoin DOGE price analysisCRYPTOCAP:DOGE price is now in the middle of a strong mirror zone of $0.15-0.20
📈 It looks like the position is now accumulating, forming a "double bottom" and then, only a way for growth, to the highs in the region of $0.45-0.50
🐻 On the other hand, the scenario of another "leg" down fits perfectly into the TA canons. That is, it is very likely that if the price of OKX:DOGEUSDT drops below $0.15, then it is already fall to $0.10)
P.S.:
#Doge is an interesting asset, it is worth watching with one eye, and with the other eye, watch how the "battle" between Trump and Musk (who is the main influencer and "pumper" of #Dogecoin) will end.
💡 And then put the two pieces of information together and make a trading decision - "easy money" !)
_____________________
Did you like our analysis? Leave a comment, like, and follow to get more
$Doge Dogecoin about 60% retracement from all time high...CRYPTOCAP:DOGE dogecoin has retraced about 60% from an all time high of about 0.49
Current price: 0.20
Reasons why i am bullish on #Doge
CRYPTOCAP:DOGE price action has remained above the 200ema on the weekly timeframe ...bullish!
- $dogecoin has committed an over 60% retracement from all time high of 0.49
- It is currently at double bottom support seen in April
#dogecoin negative money flow is thinning out
- Sentiments are neutral : neither greedy for fearful
- Price action is exactly at point of control on the weekly time frame!
Resistances above to watch: 0.32, 0.42 up to 0.69

DOGE - Another Perspective- DOGE is currently trading nearing the trendline resistance and pending breakout
- A clear breakout from this resistance line is a must to continue to bullish momentum.
- we will enter the trade after confirmed breakout
Entry: 0.221
SL at: 0.14103
TP1: 0.26035
TP2: 0.33892
TP3: 0.47751
Stay tuned for more updates.
Cheers
GreenCrypto

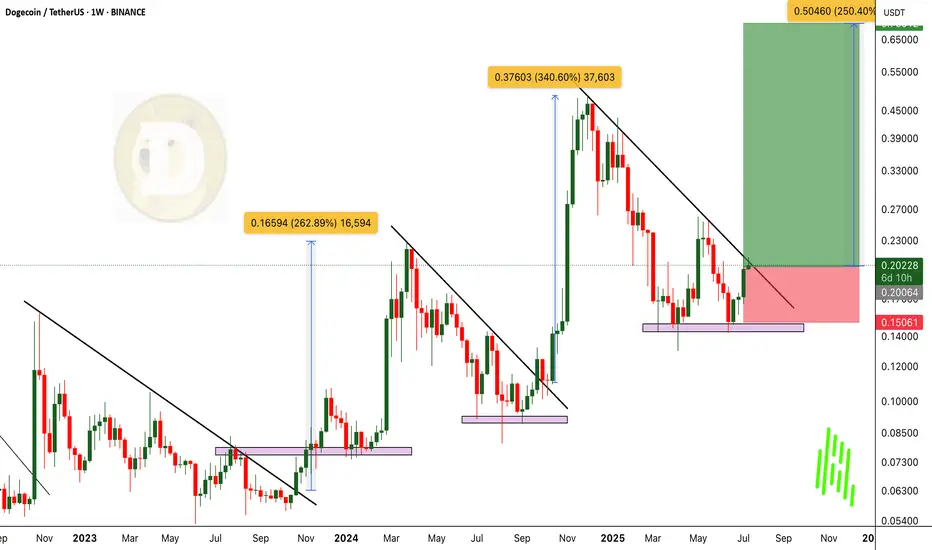
DOGEUSDT Breaking Out. 250% Rally Incoming? History Says Yes!BINANCE:DOGEUSDT is once again showing its classic breakout behavior, This time breaking above a key trendline with strong momentum. Historically, every time CRYPTOCAP:DOGE has broken out of similar structures, it has delivered powerful rallies averaging around 250% gains. And with the current bullish sentiment across the market, this setup looks ready to repeat history.
CRYPTOCAP:DOGE still appears undervalued, especially considering the broader market is already heating up. Once CRYPTOCAP:DOGE starts its move, it tends to run fast and hard – often leaving latecomers behind. This could be the start of the next explosive leg up.
For investors, this is a prime “BUY and HOLD” zone. For traders, this is the time to enter with proper risk management in place. Always use a stop loss and trail your profits accordingly.
BINANCE:DOGEUSDT Currently trading at $0.204
Buy level : Above $0.2
Stop loss : Below $0.15
Target 1: $0.27
Target 2: $0.35
Target 3: $0.48
Target 4: $0.7
Max leverage 2x
Always keep stop loss
Follow Our Tradingview Account for More Technical Analysis Updates, | Like, Share and Comment Your thoughts

DOGE LONG TRADEDoge long position, We have been extremely bullish lately so hopefully we continue and break out of this symmetrical triangle.

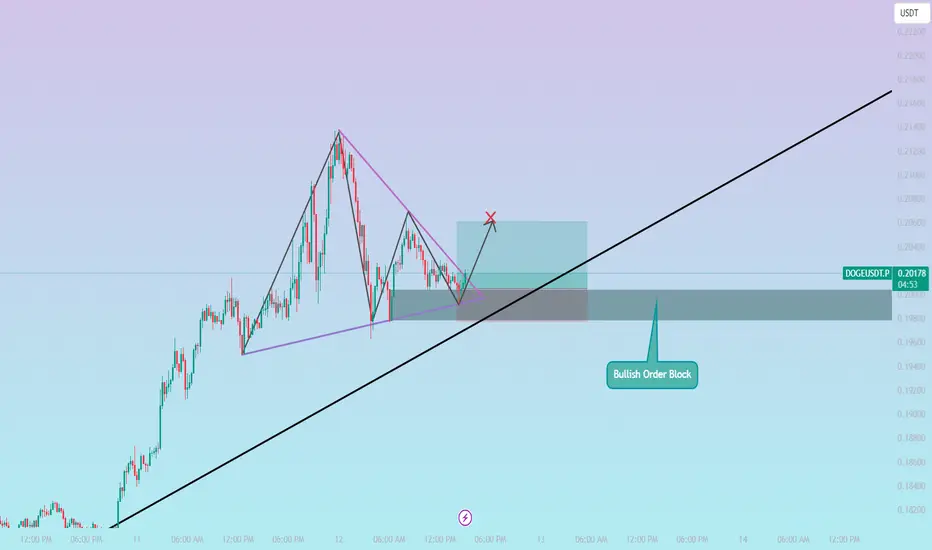
DOGEUSDT / 15M / LONG🚀 DOGEUSDT Long Opportunity | Bullish Order Block + Trendline Confluence
DOGEUSDT is showing signs of a potential bullish reversal from a Bullish Order Block on the 15-minute timeframe. Price has respected the ascending trendline while forming a corrective structure, and we can see clear liquidity grab wicks into the order block zone.
🧠 Smart Money Insight:
The price dipped into the Bullish OB where institutions likely accumulated long positions. With the trendline intact and structure holding, we expect price to push up, targeting liquidity above recent highs.
🔹 Entry: ~0.20050 (Within OB zone)
🔹 Stop Loss: 0.19772 (Below OB invalidation + liquidity sweep)
🔹 Take Profit: 0.20607 (Above recent swing high)
🔹 Risk:Reward Ratio: 1:2 ✅
📌 Confluences:
Bullish Order Block
Trendline support
Break of market structure to the upside
Clear corrective wave into OB (possible Wyckoff accumulation behavior)
🎯 If price maintains above the OB and breaks structure, this could lead to a bullish impulsive wave.
Doge can be a great long position Altcoins are about to start going up. And the Dogecoin has a strong resistance ahead. It can be a 1:9 or higher RRR.
*This is not a financial advise and is just an experimental idea.

DOGE Presses Into Long-Term Trendline — Breakout or Breakdown?DOGE is approaching a multi-month descending trendline with rising volume and an overbought stochastic RSI. Price is coiling in a tight triangle just below both the 50 and 200 EMA — a major move is on deck.
🟢 Scenario 1 – Bullish:
Break above $0.18 and reclaim of the 200 EMA ($0.20) could launch DOGE toward $0.25+. A confirmed flip of the trendline would mark a major sentiment shift.
🔴 Scenario 2 – Bearish:
A rejection here and break below $0.16 could lead to a steep drop toward $0.12 or lower. The red path shows a return to the broader downtrend if bulls fail to step in.
⚠️ Stoch RSI is at extreme levels — suggesting the next move may come soon.

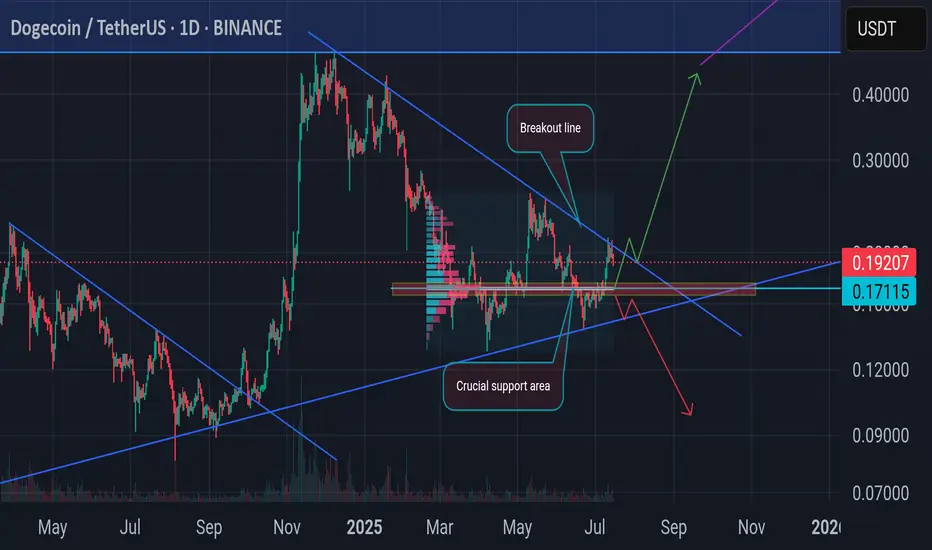
Fill your porto with DOGE :)Fill your portfolio with DOGE. DOGE's price structure 1D remains bullish. It would be impressive if it breaks through the breakout line.
⚠️ The $0.17115 support level is a crucial level to maintain, otherwise the price may decline further.
DOGE setting up a bullish Bull Flag?DOGE is moving within a descending channel after making a good run upside.
Current tend shows possibly setting up a bullish bull flag pattern. If breakout verified, DOGE will skyrocket to $0.25 range in coming days.

DOGE/USDT Breakout Theft Plan| Smart Entry + Exit| Bullish Bias🐶💰 DOGE/USDT Master Heist Plan – The Bullish Breakout Robbery! 💸🔓
(Thief Trading Style – Steal Profits, Not Dreams)
🌟Hello, Hola, Ola, Bonjour, Hallo, Marhaba!🌟
To all the fearless Market Movers & Silent Operators out there – welcome to another strategic DOGE raid guided by technical precision and macro-level insight! 📈🧠
🔐 The Game Plan – Let’s Break the Bank!
This chart outlines our long-entry mission for DOGE/USDT, based on a unique Thief Trading Style strategy. The market currently shows bullish momentum, setting the stage for an upside breakout—but not without traps! Stay sharp.
💥 Key Concepts at Play:
Pullback Zones = Entry Points (Mark the lows, grab the loot)
ATR Line Zone = High-Risk Area (Time to plan your exit)
Reversal & Consolidation Zones = Watch for fakes & traps
News Events = Potential market detonators – keep your stop-loss close
📍Entry Point – "The Vault’s Open!"
💰 Plan A: Instant execution for those already prepped.
📉 Plan B: Place Buy Limit Orders near recent 15–30 min swing lows for a stealthier entry during pullbacks.
🚨Stop-Loss Setup – Safety First, Always
📍 Recommended SL: Near the 2H swing low (around 0.15500)
🛡️ Adjust based on your personal risk, account size, and trade volume. Thieves plan smart—never go in blind.
🎯Target – Clean the House and Vanish
🎯 Primary Target: 0.18500
⚠️ Exit early if market conditions shift. The first rule of the game? Don’t get greedy.
⚡Scalpers’ Mode – Hit & Run
Only trade LONG setups. Whether you’re a heavy hitter or playing it safe, stick with the bulls. Use trailing SL to protect the bag.
📊Why This Heist Works – Under the Hood
The DOGE/USDT setup is driven by:
✅ Bullish sentiment
✅ Fundamental trends
✅ Macro drivers
✅ On-chain activity & intermarket signals
✅ COT Reports & future momentum indicators
(For full breakdown, check linkkied data 👉🔗🔍)
📡News & Risk Management Reminder
🚫 Avoid opening fresh trades during high-volatility news events.
📉 Always trail your stop to secure profits during live positions.
Adapt fast – the market changes in a blink.
❤️Support The Plan
💥 Smash the Boost button to help spread the Thief Trading Style across the platform! Let’s make smart money together, one chart at a time. Every like, comment, and follow powers the next move. 💪💵🚀
🔔 More Heist Plans Coming Soon – Stay connected, stay dangerous... and stay profitable.
🐱👤Until then – Trade Smart. Trade Thief. Make Your Mark. 💸

doge buy midterm"🌟 Welcome to Golden Candle! 🌟
We're a team of 📈 passionate traders 📉 who love sharing our 🔍 technical analysis insights 🔎 with the TradingView community. 🌎
Our goal is to provide 💡 valuable perspectives 💡 on market trends and patterns, but 🚫 please note that our analyses are not intended as buy or sell recommendations. 🚫
Instead, they reflect our own 💭 personal attitudes and thoughts. 💭
Follow along and 📚 learn 📚 from our analyses! 📊💡"

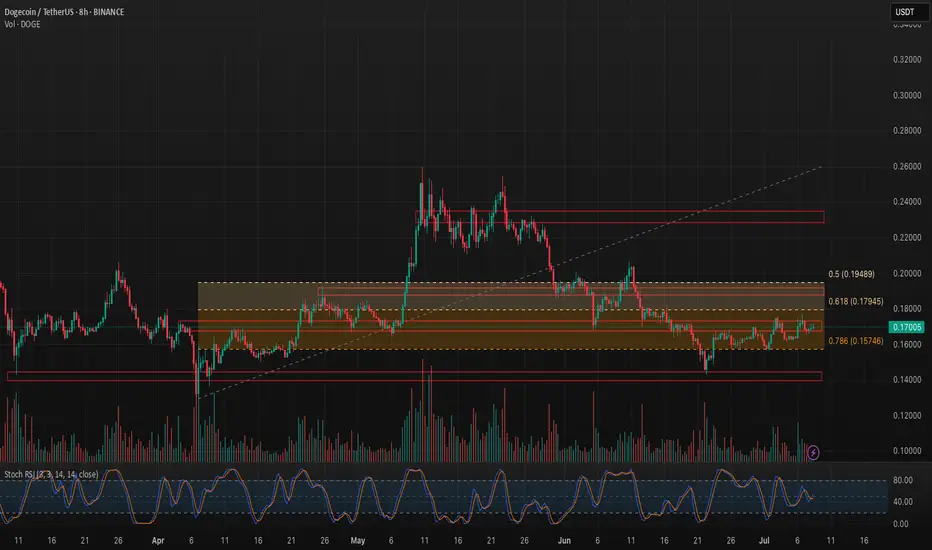
DOGE is stuck in the golden pocket... but for how long?📍Chart Breakdown:
Dogecoin is consolidating within a key Fibonacci retracement zone, ranging between $0.158 and $0.178 — what traders often call the “golden pocket.” Price is coiling just above critical support.
🟡 Fibonacci Zone (Golden Pocket):
The $0.158–$0.178 area has acted as both resistance (early May) and support (mid-June onward).
Holding this range = potential bullish continuation.
Breaking below = likely retest of $0.14 or lower.
📉 Recent Context:
Sharp drop from the $0.22–$0.23 area in early June.
Since then, DOGE has been trying to base out in this fib zone.
Trendline support from April still loosely intact.
📊 Indicators:
Stoch RSI: Mid-range (53), turning up — could indicate a potential bounce or continuation higher.
Volume: Still muted — watch for spikes on breakout attempts.
🧠 Trade Scenarios:
Bullish: Break and close above $0.178 could retarget $0.20 and eventually $0.23.
Bearish: Breakdown of $0.158 with volume = high risk of drop to $0.14
Are you ready for New Miracle ? Doge is one of them#Gold #XAUUSD #PriceAction #Fibonacci #EMA50 #TradingView #Scalping #TrendTrading #LiquidityGrab #AltcoinsSpeakLouder #TradeWithMky
What happens when price dives, grabs liquidity, and kisses the 50 EMA with a bullish shadow candle?
You get what I call a "Miracle Shot" setup.
🔹 Price retraced deeply into a golden zone (between 50–61.8% Fibonacci).
🔹 The candle with a long lower wick shows liquidity grab.
🔹 Immediate bullish rejection right from the EMA50 = clear entry signal.
🎯 Entry: Near EMA50 + confirmation candle
🛑 SL: Below the shadow
✅ TP: Fibonacci extensions at 161%, 261%, and 414%
You can already see how price exploded after this textbook setup.
In the next move (second screenshot), price creates a wick to the upside—classic sign of profit-taking or potential trap for late buyers.
✍️ If price retests EMA50 again with a valid setup, this could be your Re-entry Shot.

DOGEUSDT Technical Analysis – Is Dogecoin Preparing for a Major 🚨 DOGEUSDT Technical Analysis – Is Dogecoin Preparing for a Major Move?
As predicted in my previous analysis, all key support and resistance levels have worked out perfectly.
📌 Currently, DOGE is facing a major resistance zone (red area) and has been rejected after testing it. If the price fails to break this zone and selling pressure continues, the next strong support areas lie between 0.15197 and 0.10508. These ranges could act as solid buy zones.
🚀 On the other hand, if DOGE manages to break above the red resistance, we could see a move toward the first major target at 0.19600, followed by 0.20369 and 0.20867.
📊 This is a crucial decision point for Dogecoin. Whether it breaks out or pulls back, both bullish and bearish scenarios are clearly mapped.
🔍 Follow me for real-time price action updates, breakout alerts, and clean technical charts!

DOGEUSDT last short before run shortDOGEUSDT last short before run short. Looks like classic head and shoulders with support at the bottom of target.

Trending Tokens Are Traps they Destroy your Portfolios🚨 Why Everyone Falls for Trending Projects That End in Disaster
Have you ever bought a token just because everyone was talking about it?
And the moment you jumped in, it started crashing?
This isn’t a rare story; it’s a repeating trap. But why does our brain love buying at the worst possible moment?
Hello✌
Spend 3 minutes ⏰ reading this educational material.
🎯 Analytical Insight on Dogecoin:
BINANCE:DOGEUSDT is currently forming a tight price structure, resembling a compressed spring just below a key daily resistance and trendline. A clean breakout above this area, supported by volume, could trigger a strong bullish continuation, with a projected upside of approximately 30 percent toward the 0.21 level. Traders should monitor this setup closely for confirmation before entering any positions. 📈🐶
Now , let's dive into the educational section,
💸 Trend Equals Triggering Your Greed
Trending coins don’t just pump prices; they pump emotions. One word: FOMO. Fear of missing out makes us ditch logic, ignore risk, and buy because it feels like everyone else is making money. That’s when the trap is set.
🧠 The Market Forgets, But You Shouldn’t
The crypto space is littered with the graves of hyped-up tokens. The cycle is always the same: quick pump, viral noise, massive retail entry, then a violent crash. The names may change, but the pattern doesn’t.
📊 Practical TradingView Tools to Spot Sketchy Trends
Before you click that “Buy” button just because something is trending, take a breath and open your charting tools. Here's a shortlist of powerful features you can use on TradingView that’ll help you filter out dangerous pump tokens:
Volume Profile: Shows where real smart money sits. If most volume spikes near the top, chances are whales are exiting.
RSI (14) : If RSI is above 70 and climbing with no pullback, odds are you're catching it too late.
Anchored VWAP: Anchor it at the start of the trend and see how far price has stretched from rational levels.
Stochastic RSI: Sharp crosses in overbought zones equal major risk signals.
Make it a habit to cross-check multiple timeframes with these tools. Blindly following trends without analysis? That’s how portfolios get burned.
🧪 Pre-Entry Checklist That Could Save You
If something feels “too hot to miss,” ask yourself:
Is the chart readable, or just a straight line up?
Are there healthy pullbacks or just blind momentum?
Is volume spiking only at the top?
Does the project show signs of organic market interest?
Do your TradingView tools confirm a smart entry?
Stick to this list, and you’ll avoid being just another exit-liquidity victim.
🕵️ Spotting Fake Pumps Before It’s Too Late
Here are the red flags no one talks about but every rug has them:
Massive vertical candles in low timeframes
Chaotic candlestick structures with no rhythm
Sharp volatility without any legit updates
Sudden spikes in follower hype and buzz
Real analysts don’t get excited when everyone else is; they start questioning why.
💥 Even Pro Traders Get Caught
Yes, even experienced traders can fall for a perfectly staged hype cycle. Why? Because human brains are wired to chase the crowd. That’s why having a pre-built system is critical. If you rely on gut feelings in a FOMO storm, you’re gambling.
✨ Need a little love!
We put so much love and time into bringing you useful content & your support truly keeps us going. don’t be shy—drop a comment below. We’d love to hear from you! 💛
Big thanks , Mad Whale 🐋
📜Please remember to do your own research before making any investment decisions. Also, don’t forget to check the disclaimer at the bottom of each post for more details.

Trading plan for DOGEA new month has begun, and I've marked the key monthly pivot levels for you. I've also outlined potential scenarios based on the higher timeframe analysis. Additionally, I've highlighted important levels for this week's trading and identified setups that could drive price toward the resistance zone. However, in a bearish scenario where the trendline breaks, we might see a retest of the local low before any upward correction toward the $0.3 level
Full analysis is available in the video - happy trading!
