DOGE Ready for PUMP or what ?The price is within a descending triangle, which is discouraging, but this market often behaves contrary to these patterns, and it could be the start of a new price increase. I won’t fall for these patterns anymore.
Best regards CobraVanguard.💚
DOGEUSDT_FCD13E trade ideas

DOGE UpdateDOGE Price Update
DOGE is currently forming a symmetrical triangle pattern, holding above the support line. An upward rally is likely, but for a bullish confirmation, DOGE must break above the resistance trendline on the daily timeframe.
Strategy:
~ Entry / Accumulation: $0.144 to CMP
~ Invalidation: Daily candle close below the support line ($0.144)
~ Target: $0.30 – $0.50
Note: Don’t rush into the entry. Always conduct your own thorough research and analysis before investing.
Regards,
Dexter

Much DOGE Much WOW!DOGE will caught you on the guard to eat you! Beware! You know the direction well! Its a well liq hump!

DOGEUSDT Buy Long SetupWait for entry, if the tp hits first, then ignore the trade, I will share new entry.

Doge Buy / Long SetupDoge has some Bullish Momentum, Invalidation if 4hrs closes below the mentioned point, then close on entry, otherwise wick doesn't matter. If tp achieved first then Cancel the trade.

DOGE LONG- DIvergence price with stoch
- price at demand area
- BTC possible break out
- stoch W and M oversold

Dogecoin $0.1725 Next Target ? #DOGE
The price is moving within a descending channel on the 1-hour frame, adhering well to it, and is on its way to breaking it strongly upwards and retesting it.
We have a bounce from the lower boundary of the descending channel. This support is at 0.1624.
We have a downtrend on the RSI indicator that is about to break and retest, supporting the upside.
There is a major support area in green at 0.16000, which represents a strong basis for the upside.
Don't forget a simple thing: ease and capital.
When you reach the first target, save some money and then change your stop-loss order to an entry order.
For inquiries, please leave a comment.
We have a trend to hold above the 100 Moving Average.
Entry price: 0.1656
First target: 0.1682
Second target: 0.1713
Third target: 0.1752
Don't forget a simple thing: ease and capital.
When you reach the first target, save some money and then change your stop-loss order to an entry order.
For inquiries, please leave a comment.
Thank you.

DOGE/USDTCRYPTOCAP:DOGE can easily pump to $1. Measuring the range inside the triangle points to a potential 550% gain from the current price. CRYPTOCAP:DOGE is also a strong indicator for altcoin season. Do not fade the Elon Musk coin.

DOGE Short Term pullback prior to breaking trendI am bearish on Dogecoin for the next 10 days or so, but overall bullish to break the downward trend for months now.
Waiting for a break above the longterm downward then a retest would be the safest play. A more aggresive approach may be to put some orders in at the recent support levels with a stop loss near the recent lows.
Doge is a popular token and meme that has a large following. I think there are many long term holders than any other meme.

DOGE Short SetupTight SL, 1:3 Risk-Reward.
We might go higher, but current key levels and price actions tells me to go short setup.

The Right Way to Manage Stop Loss: Dynamic Logic for Smart ExitsContext
In fast-moving markets, static stop losses often sabotage good trades by exiting too soon or too late. This approach uses dynamic, logic-driven stop loss adjustments that adapt to market context instead of sticking to a single fixed distance.
⸻
Key Principles of This Stop Loss Logic
Contextual Initial Placement
The stop is never just a fixed percentage below entry. It adapts based on recent swing lows/highs, ATR volatility, and trend confirmation signals.
Dynamic Extension in Favorable Conditions
If price retraces but shows bullish reversal evidence such as deep oversold signals, positive divergence, or compression breakouts, the stop loss is extended instead of closing immediately. This prevents cutting winners during normal pullbacks.
Tightening When Momentum Fades
If momentum weakens (for example, ADX drops, failed bounce, or resistance rejection), the stop is tightened dynamically. This reduces drawdown if the trend fails.
Clear Exit Triggers
The system can exit on consolidation breakdowns below support, confirmed bearish reversal patterns, or time-based exits if no continuation happens.
⸻
Examples and Visuals
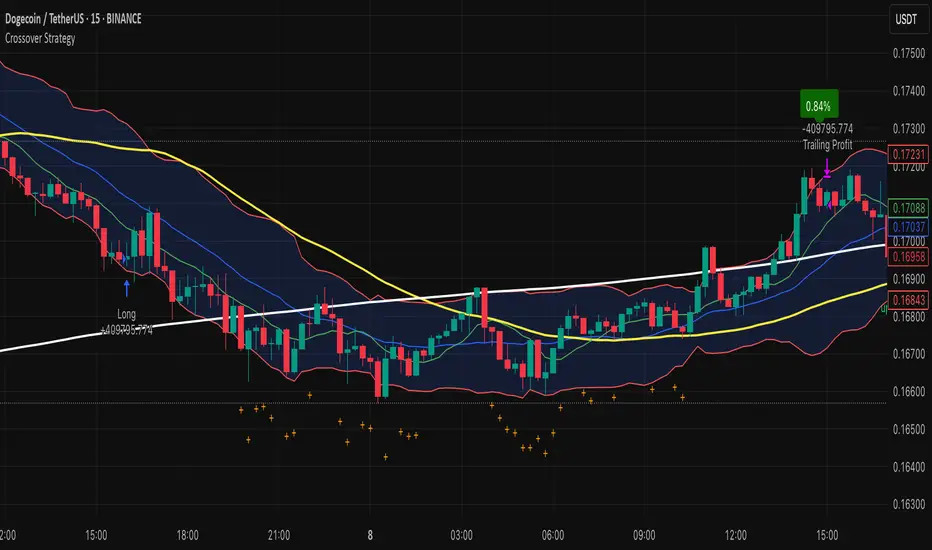
Below, I’ve included chart examples with screenshots from my Multi Crossover Strategy . These images illustrate how dynamic stop loss management behaves in real conditions—showing entries, extensions during retracements, and exits triggered by different scenarios. You can see how the logic responds to changing volatility and trend strength in real time.
The "+" signs mark bars where the position would have closed using the default settings of 2.5 ATR Multiplier stop loss. A bullish reversal signal extended the stop, allowing the trade to close profitably instead of at a loss.
This example shows an early exit triggered by a consolidation breakdown. The system closed the position before the maximum stop loss was reached, limiting the loss as bearish momentum increased.
Example for lower high close to reduce loss. Here, the position was closed after a failed bounce and the formation of a lower high, signaling a likely continuation of the downtrend and helping to reduce the loss before a deeper move.
⸻
Advantages Over Simple Stop Losses
Adaptation
Stops react to volatility and price structure, not arbitrary distances.
Risk Mitigation
Dynamic tightening locks in gains faster when momentum fades.
Confidence to Stay In
Dynamic extension reduces the chance of premature exits during healthy retracements.
⸻
How to Use This Approach
When designing your strategy, start by defining a volatility-adjusted stop using an ATR multiplier as the base distance from entry. You can then set a maximum allowable loss in percentage terms to cap risk exposure to a fixed threshold.
After establishing your initial stop, consider adding layered adjustments that respond to different levels of reversal risk. For example:
ATR Multiplier: the factor used to calculate the initial stop distance based on market volatility.
Maximum Loss (%): the maximum risk per trade, defined as a percentage below the entry price.
Tight Stop Loss (%): a closer stop level that activates when early signs of a potential reversal appear, such as weakening momentum or minor bearish movement.
Bearish Stop Loss (%): a further tightening of the stop distance when stronger bearish reversal signals occur, including failed bounce attempts, lower highs, or clear resistance rejections. This level reduces the tolerance for further losses but still allows the trade to remain open if price stabilizes.
Extended Stop Loss Percentage Add-On: an additional percentage beyond the maximum loss cap, temporarily applied if strong bullish recovery signals appear.
In addition to these percentage-based stop adjustments, you can define instant exit rules that immediately close the position as soon as specific structural conditions are met. Unlike percentage-based stops, instant exits do not wait for further price movement or confirmation. They are typically used to react to decisive events such as a confirmed breakdown below support, a lower high after a failed bounce, or a sharp rejection at a resistance level. This combination of tightened stops and instant exit triggers allows for a flexible but disciplined approach to managing trades.
Pro Tip:
Most traders lose because their stops don’t evolve with the trade. Build a logic tree:
If trend = strong ➡ extend stop
If reversal risk ➡ tighten stop
If clear reversal signs ➡ exit
⸻
Disclaimer: This content is for educational purposes only and does not constitute financial advice. Please do your own research before making trading decisions.

Doge still holding as planedSo SL was set perfectly, if nothing bad comes from Trump mouth we should be able to book profits🤣🤣

Dogecoin (DOGE): Keeping Eye on 200EMA | Looking For BounceDogecoin is still hovering above the 200EMA, where we see some kind of weakness but the price still remains above the line so we are keeping our bullish game plan still active.
We are looking for a bounce on daily timeframe from 200EMA where we will be looking at $0.25 for a proper breakout, which then would send the price as high as $0.37
Swallow Academy

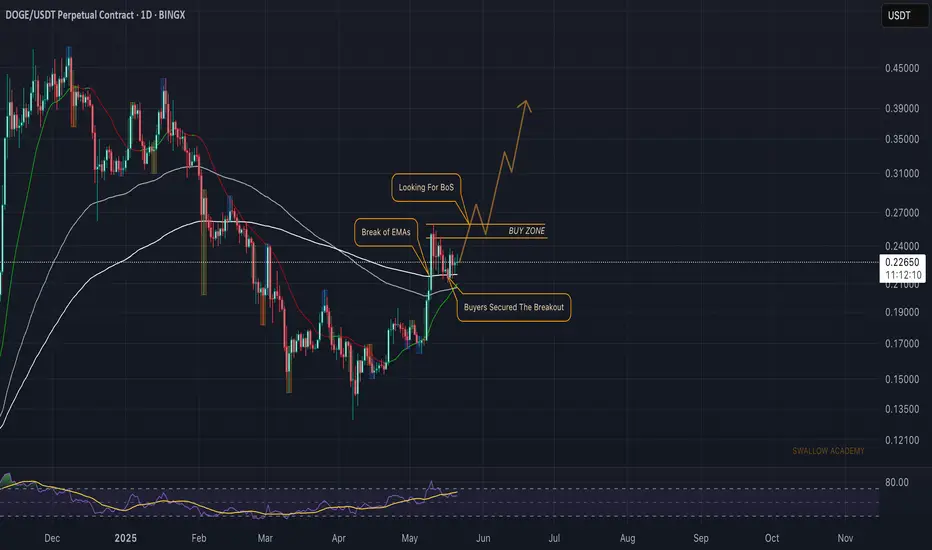
Dogecoin (DOGE): Breakout From EMAs + Successful Re-Test | BOS?Dogecoin had recently broken the lines of EMAss (100 & 200), where, after a successful retest, buyers took over the area and now are heading towards the Break of Structure Area.
Once we get the BOS, we will be looking for a long position near this area, so we wait for now...
Swallow Academy
Dogecoin $1.17 Next Target (591% Profits Potential)From its June 2022 bear market low, Dogecoin managed to grow more than 880% to its December 2024 peak price. The peak happened around the 0.618 Fib. extension level.
The next major level based on Fibonacci proportions in relation to the 2021 bull market/2022 bear market stands at $1.17, this would give us 591% profits potential from current price and a total of 2281% total growth coming from the June 2022 bottom. That would the total size of the bull market for Dogecoin if it peaks at $1.17, more than 23X.
Prices go up but they don't remain up. After a bullish wave there is always a correction. After a bull market there is always a bear market.
Dogecoin is now back at baseline levels but within a higher low. All the same resistance levels that were conquered in late 2024 will need to be challenged again. All these levels will break easily. The main resistance will be found at $0.59 followed by the previous, 2021, all-time high, around $0.74.
What other resistance levels are relevant if the market doesn't perform great?
I will give you the exact numbers. Below the last high $0.35 is a relevant level. Hitting new highs compared to December 2024 $0.70 needs to be watched. New ATH $1.05 and the rest of the numbers mentioned before and shown on the chart.
My guess? Above $1.00. There is no reason for the market to peak any lower.
Thanks a lot for your continued support.
Namaste.

DOGE, expanding upside pressure from 0.17 below. Targeting 0.4!DOGE had a good year last year 2024, going parabolic -- and reaching as high as 0.48.
Then as with any overheated price growth with the overall market, it went into extreme corrective mode -- trimming down as much more than 3x its price, tapping major lows at 0.14 area.
Now, based on its current long term metrics. We are now seeing some baselining action at the current price range at 0.17 area. Based on our diagram above, a hop signal has been spotted hinting of an expanding upside pressure on the present price zone.
DOGE has corrected to below bargain zone at 78.6 Fib levels. A no-brainer key area where buyers get the most discounted price. The MAJOR shift everyone is waiting for is currently transpiring this week.
Higher lows on long term momentum metrics has been registered as well -- conveying intense ascend pressure.
Ideal seed is at the current price and anything below 0.17 is a definite bargain.
Spotted at 0.169
Mid Target 0.5
Long term target 1.0
Trade safely. Market is still Market.
Not financial advice.
TAYOR.

DOGECOIN Eyes Major Breakout – Trend Channel in Controlhello guys!
doge seems potential now!
DOGECOIN has successfully broken out of a long-standing bearish trendline and is now respecting a well defined ascending channel structure.
After a clean retest of both the midline and the demand block around 0.1950–0.2150, the price is showing renewed bullish pressure. As long as price holds above this key support zone, we can expect further continuation to the upside.
what I see:
✅ Breakout of descending trendline confirmed
✅ Strong structure support from the demand block (0.1950–0.2150)
✅ Clean reaction from channel midline
✅ Momentum currently favors continuation of the bullish trend
🎯 Bullish Targets:
TP1: 0.2530 (recent swing high)
TP2: 0.2750 (channel upper boundary)
TP3: 0.3035 (major horizontal resistance zone)
🛑 Stop-loss idea: Below 0.1950 (invalidates bullish structure)

DOGE - IDEA index to my B/ september pumpWe have an instrument — DOGE — and I see a certain pattern. From one pump zone to the next, it's 14.4 cm, and this happens three times. From the high zone after these pumps, it's 15.5 cm, also three times. From the high at $0.74 to the high at $0.48, we get 40.7 cm. Similarly, from the very first DOGE pump where the mega rally began, there's also a 40.7 cm gap to the next strong pump.
After analyzing the old “Sparta” idea
I came to the conclusion that the price is being compressed within a specific range, and after some time, this range gets multiplied by a numerological coefficient. To get 444, you need to multiply 333 by 1.333. But another coefficient close to this value is 0.69 (zone) multiplied by 2, which equals 1.38.
On the chart, you can see that from the starting point we have 14.4 cm. If we apply the derived coefficient (0.69) — taken from the length of the circle — we get 20.9 cm. That is, our diameter is 14.4 cm. If we multiply it by Pi (3.14), we get the circumference: 45.2 cm. Then, we need to find the 0.69 zone, which equals 0.69π = 2.166. That means we divide 45.2 by 2.166 and get 20.9 cm. If we measure this from our first control point (from where we took the diameter), we arrive precisely at the bottom from which the trend reversal began.
Now, keeping in mind the coefficient that the cycle follows — 1.333 — if it moved exactly, it would be too obvious and there wouldn’t be the necessary chaos on the chart. Since we have more than one cycle, multiplying 0.69 × 2 = 1.38 gives us 28.8 cm, which precisely points to the high formed at $0.23.
You might not believe me or understand, but these are facts. I’ve provided you with the chart — you can verify everything yourself.
What does this give us?
This provides us with valuable information about how the trend develops after the strongest initial pump of the instrument, allowing us to capture all the movements by trading within a channel using complex percentages and taking massive % gains.
What do we need to do? Let’s repeat:
Study the distance from the lows before the pump to the next low right before the next pump (in cm).
Then we carry this same cycle backward to confirm its validity in the past and again forward — that will be the main one from which strong growth begins.
From the measured value (in cm), we take it as the diameter and multiply by Pi to get the circumference, which helps us understand what might come in the future.
We trade the 0.69 zone or 69%, whichever is easier for you. To find this zone, divide the circumference by 2.166.
Then multiply the result by the coefficient 1.333 or 1.38 — this will show us the final zone of growth or decline.
This math can also be applied not only to centimeters but to time bars. For example, if from one low to the next is 492 days, you can use the same formulas to extract valuable insights.
So, what’s next for DOGE?
If the zones I’ve already mentioned have occurred, how do we trade the future?
When we extend the diameter — that is, the 14.4 cm cycle in our case — we do this three times. Pi is 3.14, so obviously:
14.4 × 3 = 43.2
Our Pi value is 45.2.
That means 2 cm to the right will be the low before strong growth. This falls around September 1st, give or take — meaning sometime within the first two weeks of September a strong rally should begin, with acceleration in late September 2025.
I came to all these conclusions after 2 hours of work and recently developed this linear strategy — or more precisely, I had a breakthrough on it — so I expect a lot more will be added as I continue writing the book.
I also realized something else: remember the correlation between the highs and the strong pumps at 40.7 cm? We apply the same formula:
40.7 / 2.166 = 18.8
Which precisely points to the low before the pump.
Then we take:
(40.7 / 2.166) × 1.38 = 26 cm
Which also points to the same low as the 20.9 cm from the beginning of the 14.4 cm diameter.
An incredible mathematical correlation found using the formula I discovered.
To back up my words, I will index this idea and publish this excerpt on TradingView so it’s visible and verifiable. I hope the idea plays out, and that DOGE forms a local bottom in early September, followed by strong growth with acceleration at the end of September.
To be clear, I just described how the internal structure works — and it is only Pi that points directly to the strong September rally. Let's see what happens.

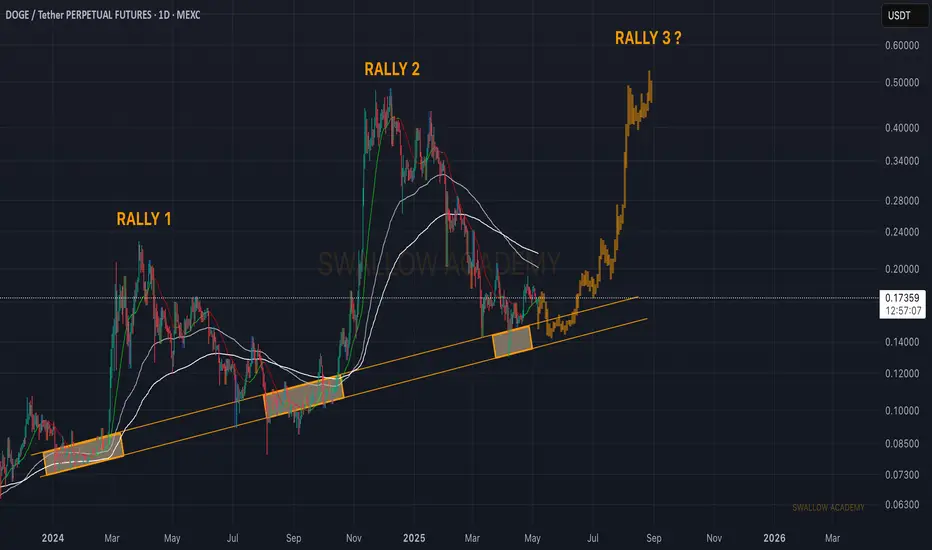
Dogecoin (DOGE): Getting Ready For Rally 3 | Possible Good BuyWe decided to take a broader look at Dogecoin, where we are seeing a price at a supportive trend, which might send the price to a very fast and quick upward movement, which could give us 200% market price movement from here.
We are going to keep this kind of game gameplan as long as we are above or inside our bullish trend line here.
Swallow Academy
Buy setup by TiqGPT Analyzing the provided charts for Dogecoin/TetherUS across multiple timeframes, we observe a consistent pattern of consolidation and minor fluctuations within a defined range. The 1D chart shows a downtrend with recent attempts at recovery, marked by small bullish candles. The 4H and 1H charts indicate a ranging market with price oscillating around the 0.1635 to 0.1650 levels, suggesting a lack of strong directional momentum.
The 15M, 5M, and 1M charts further detail this consolidation, with price making higher lows and lower highs, indicative of a compression in volatility and potential preparation for a breakout. The repeated tests of the 0.1635 level across lower timeframes suggest it's a significant area of short-term support.
INSTITUTIONAL THESIS:
Institutions may be in a phase of accumulation within this range, using the lack of clear directional momentum to quietly build positions. The repeated support tests and tight consolidation indicate preparation for a potential upward move, as institutions capitalize on the compressed volatility to trigger a breakout.

DOGE/USDT Rebound from Key Demand Zone! Bullish Rally Incoming?
🔍 Technical Analysis Overview:
1. Strong Demand Zone (Support Area):
DOGE has just bounced off a strong demand zone around $0.15000 – $0.16318, which previously acted as a significant accumulation area (highlighted in yellow). This signals a potential trend reversal from bearish to bullish.
2. Bullish Bounce Confirmation:
Price action is forming a potential "higher low" in this support area, indicating the early signs of a bullish structure.
3. Key Resistance/Target Levels: If momentum continues, DOGE could target the following resistance zones:
📍 $0.19637 – Initial minor resistance.
📍 $0.21000 – Previous consolidation area.
📍 $0.24911 – $0.31170 – Mid-term targets.
📍 $0.41583 – $0.48432 – Major resistance zone for long-term rally.
4. Short to Mid-Term Outlook:
The price is showing signs of a potential "V-shaped recovery." The yellow arrow suggests possible minor pullbacks before a continued bullish move toward higher resistance zones.
💡 Potential Strategy:
Entry: Look for re-entry opportunities on a retest of the $0.16 – $0.18 zone with bullish candle confirmation.
Stop Loss: Below $0.15000 (key invalidation level).
Take Profits: $0.196 – $0.249 – $0.311 – $0.415 (ladder out positions).
🚀 Conclusion:
DOGE is currently in an exciting technical setup, rebounding from a major demand zone with a strong potential for a bullish trend reversal. If volume supports and broader crypto sentiment improves, a strong upside rally could be in play in the coming weeks.
#DOGE #Dogecoin #DOGEUSDT #CryptoAnalysis #TechnicalAnalysis #Altcoins #CryptoTrading #Breakout #SupportAndResistance #BullishReversal

DOGEUSDT soon above 0.20$ and then bull market is just startedAS we can see price is near two major daily supports which are:
A. 0.14$ B. 0.10$ and here near these two daily supports we can expect high volume pump and breakout of 0.21$ resistance and then after that the breakout pattern is completed and heavy pump will lead.
DISCLAIMER: ((trade based on your own decision))
<<press like👍 if you enjoy💚
