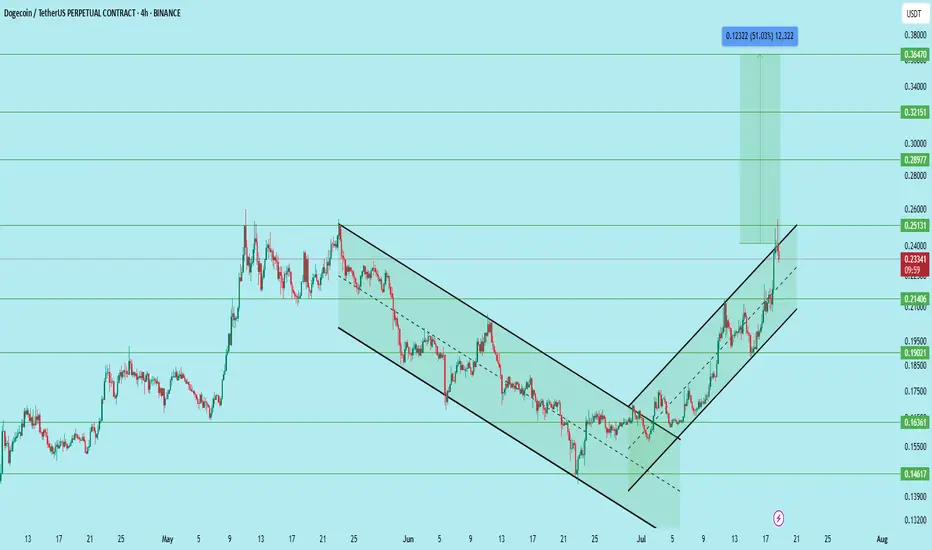
DOGE/USDT – Bullish Setup with Clear Channel BreakoutDogecoin has successfully broken out of a falling wedge and is now trending within a rising channel on the 4H timeframe. The price recently reclaimed the 0.214 support zone and is now showing continuation with strong volume and structure.
After the breakout and multiple retests, the pair offers a compelling long opportunity.
Setup Details:
Entry Zone: 0.208 to 0.214
Stop Loss: 0.186
Targets:
• 0.251 – First major resistance
• 0.289 – Mid-level breakout target
• 0.321 – Psychological round number
• 0.364 – Final target (approx. 51% move)
Technical Structure:
Breakout from falling wedge followed by bullish channel, Higher highs and higher lows clearly forming, Volume supports accumulation near breakout levels, Support holding above 0.214, confirming demand
Support Zones:
0.214 (reclaimed)
0.190 (intermediate)
0.163 (major demand zone)
Resistance Zones:
0.251
0.289
0.321
0.364
This setup offers a clean risk-reward ratio with confirmation on trend continuation. A rejection at 0.251 may present another opportunity to re-enter on a retest.
DYOR. Not financial advice.
DOGEUST trade ideas
DOGEUSDT Above Key SupportHi there,
DOGE/USDT looks bullish at H1 with two potential price targets for a bias of 0.2290.
The price made a higher low at the 0.1900 area zone and pushed above the key level of 0.1990, and it is hovering above this level. Now, as long as the 0.1900 sustains the 0.1963 low, then the price will rally to previous highs.
Happy Trading,
K.

DOGE daily timeframe updateOn-Demand Analysis: ❤️Like this post for more analysis!:
CRYPTOCAP:DOGE ’s surge combines a technical breakout, institutional validation, and sector rotation. While overbought signals suggest potential consolidation, the $0.25-$0.27 zone now acts as solid support
Support Zone: A strong base is at 0.2500-0.2700, where buyers might step in.
Resistance Level: The next big test is at 0.48434—break that, and it could climb higher!
Falling Wedge: This pattern, with its narrowing lines, often signals a bullish move if it breaks above 0.48434.
Momentum: The uptrend has steady volume, boosted by market activity.
Timeframe:Watch the next few days for the wedge to break out.
Possibilities:
Bullish Move: A jump above 0.48434 with good volume could push it to 0.5000 or more!
Bearish Drop: A fall below 0.2500 might take it back to 0.19621—stay careful!
Safety Tip: Set a stop-loss below 0.2500 to stay safe.
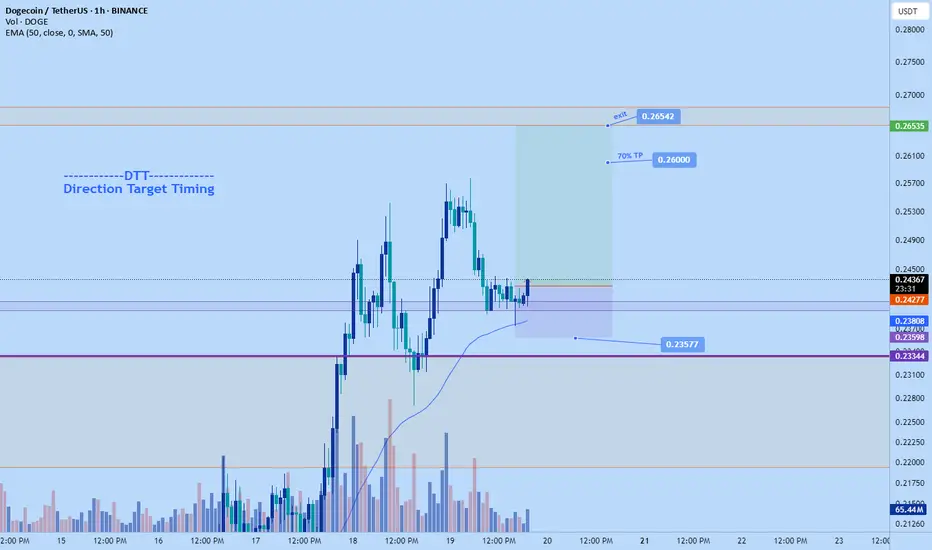
#DOGE Update #1 – July 21, 2025#DOGE Update #1 – July 21, 2025
Dogecoin has made healthy retracements after both of its last impulsive moves, maintaining a technically sound structure. I took a profit yesterday but didn’t share it due to higher risk.
Now, I've opened the Long position visible in the chart because I believe DOGE is targeting the second leg of this impulsive move, aiming for the $0.29 zone. I’m expecting approximately 6% gain from this setup.
The trend remains bullish, and pullbacks have been met with solid support, giving this trade a high probability of continuation. That said, always be cautious with sharp volatility.


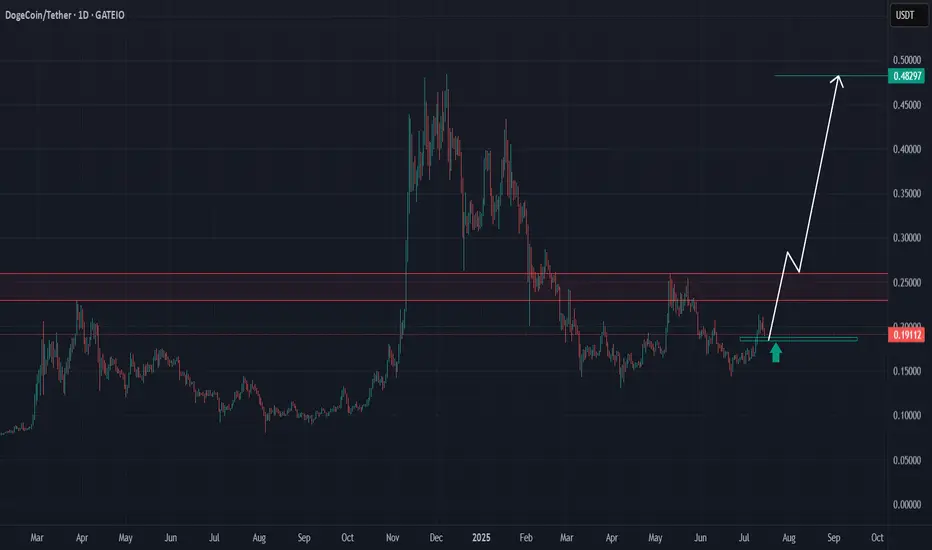
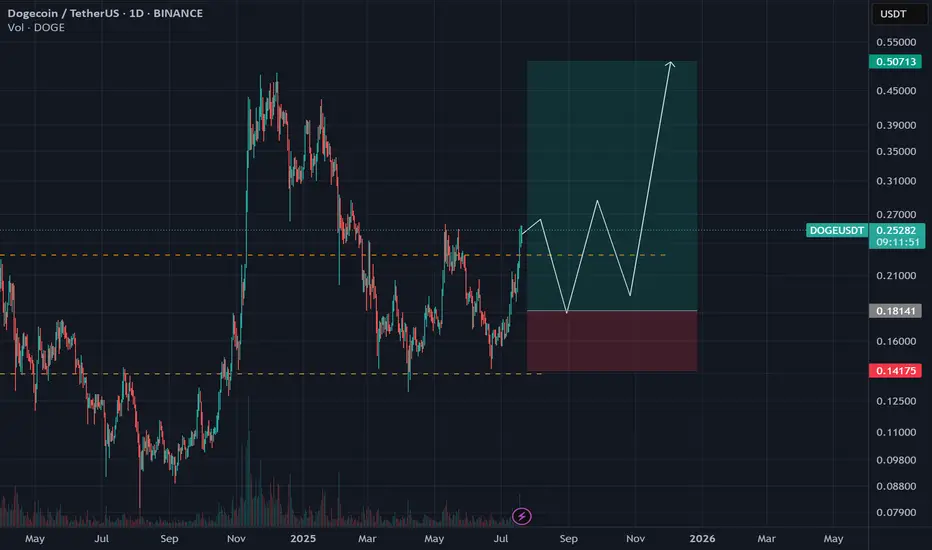
Dogecoin at a Key Turning PointDogecoin is now sitting around $0.19, inside a green zone on the chart where buyers are expected to step in.
The price is starting to move up from here, heading toward the red zone between $0.23 and $0.26 . This red area is where sellers were active before, so it’s an important level to watch.
- If Dogecoin can break above this red zone with strong buying volume , it could aim for the previous high around $0.48.
- If it struggles to move past this level, it may mean that whales are still selling, and the price could fall back down toward $0.08.
COINBASE:DOGEUSD BINANCE:DOGEUSDT BYBIT:DOGEUSDT BINANCE:DOGEUSDT.P
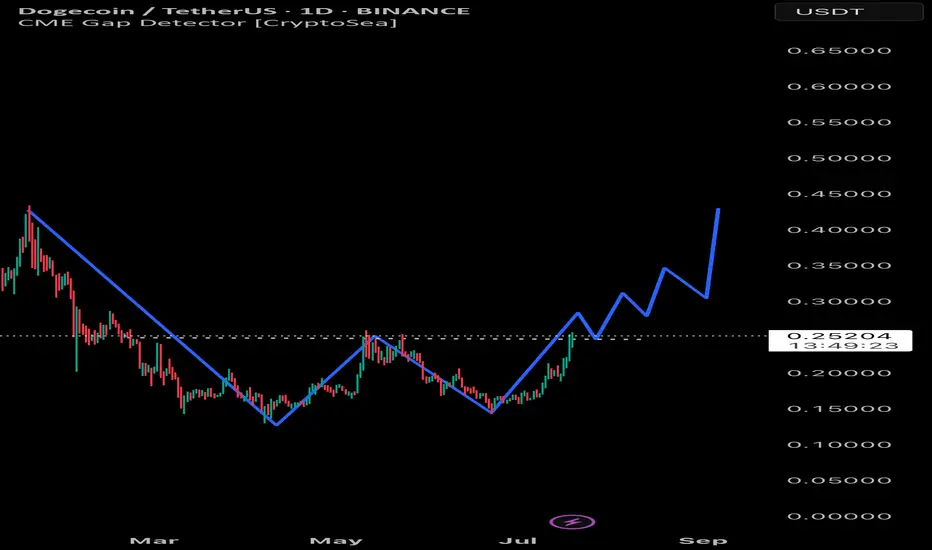
DOGEUSDT Technical Analysis - July 20, 2025DOGE appears bearish long-term (Dec 2024 ATH: $0.48), but recent price action reveals bullish divergence.
🔑 Key Observations:
1️⃣ April 2025 "Weak Support" ($0.15):
Low-volume consolidation → weak seller commitment.
Swift breakout confirms this was a liquidity grab by bulls.
2️⃣ Bullish Momentum Acceleration:
Minor resistance at $0.25 breached with 24% above-average volume (July 15).
RSI rising from neutral (58) → room for upside.
3️⃣ Declining Seller Liquidity:
Order book depth: Buy support at $0.23 is 3x stronger than sell pressure at $0.26.
Funding rates neutral → no overheated long squeeze risk.
🎯 Forward Outlook:
Short-term: Pullback to $0.27-$0.28 (liquidity sweep) likely before continuation.
Targets: $0.45 (pre-2024 resistance) → $0.50 (psychological level).
❗ Risk Management:
Invalidation: Daily close below $0.22.
Position Entry: Limit orders near $0.28 with 2:1 R/R.
📊 Chart Annotations:
Green zone: Optimal buy area ($0.27-$0.28)
Red line: Key invalidation ($0.22)
Blue arrow: Projected path
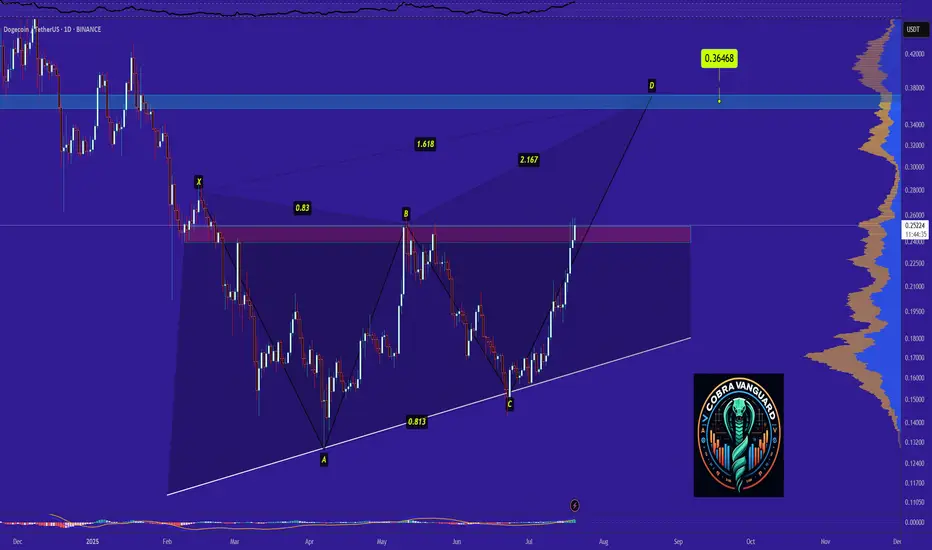
Dogecoin - Time to buy again!So if you pay attention to the DOGE chart you can see that the price has formed a Ascending Triangle which means it is expected to price move as equal as the measured price movement.( AB=CD )
NOTE: wait for break of the triangle .
Best regards CobraVanguard.💚
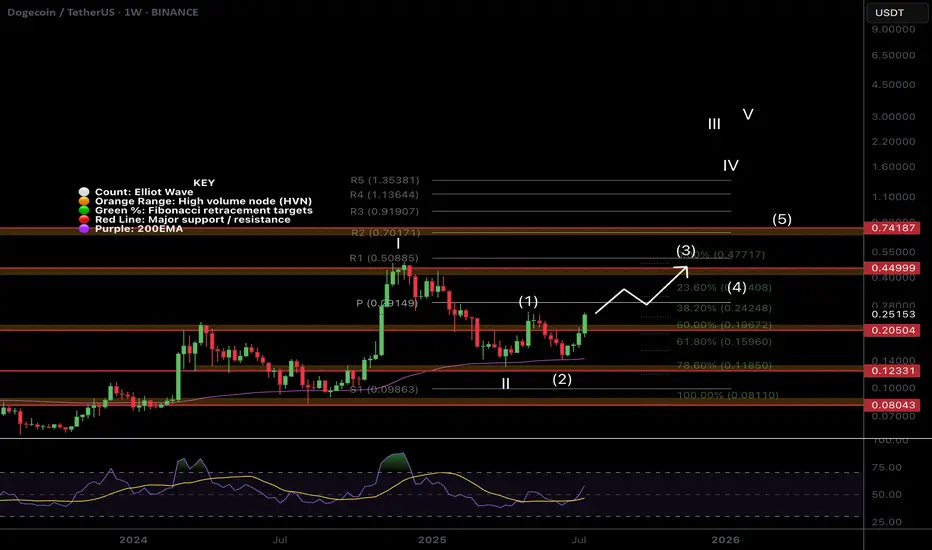
$DOGE Flipping to Bullish Structure!CRYPTOCAP:DOGE is coming to life after a second test of the weekly 200EMA as support and about to make a higher high, cementing in that higher low and flipping the macro structure bullish!
If the count is correct wave 3 of (III) should be powerful! The weekly pivot should put up a challenge as the first resistance before the High Volume Node at $0.45
Safe Trading
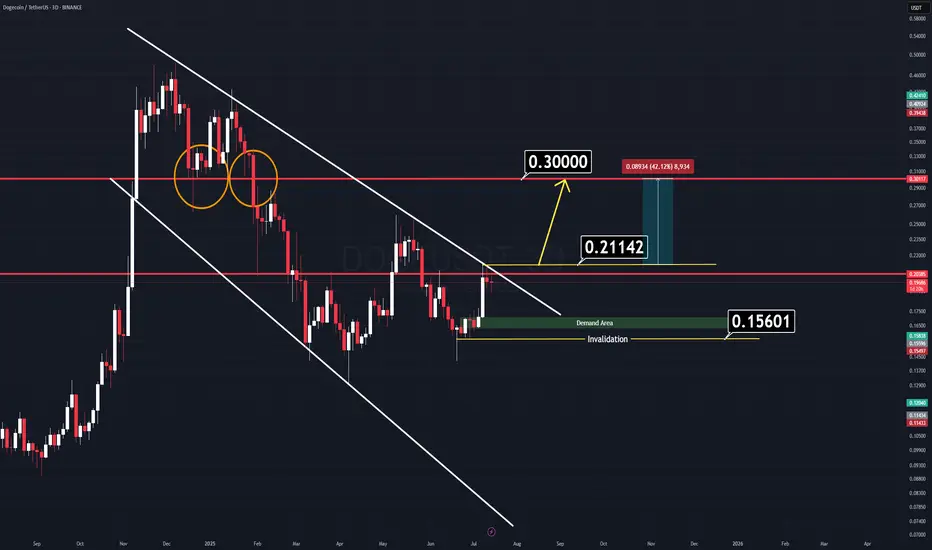
DOGE Analysis (3D)There’s a very simple and clear chart setup on Dogecoin (DOGE) right now.
We have two major horizontal key levels and a channel that is about to break down. If the price manages to close above the yellow-marked line ($0.21142), we can expect a strong rally to follow.
There’s no need for complicated indicators cluttering the screen — all relevant levels are clearly marked on the chart.
Two Logical Entry Approaches:
1️⃣ Breakout Entry: Enter on a confirmed breakout. (Waiting for a daily candle close on a memecoin might slightly reduce your profit range, but it’s the safer approach.)
2️⃣ Demand Zone Entry: Wait for the price to retrace to the green demand zone — though this scenario seems less likely for now.
A combined approach can work best: enter on breakout, use the horizontal levels as support, and set a tight stop-loss to manage risk.
Good Luck.
$1 in the Horizon for $DOGE!We’ve got something interesting brewing on CRYPTOCAP:DOGE right now:
Monthly trend is active
Uptrend in place for over a year (not relying on that timeline, but historically, targets hit within it)
If we can get above $0.30 and hold, the path to $1 opens up for the first time.
Other similar charts are also aligning for exponential moves, setting up to break out of multi-year consolidation patterns.
Keep a close eye on CRYPTOCAP:XLM as well — it’s shaping up with a very similar structure.

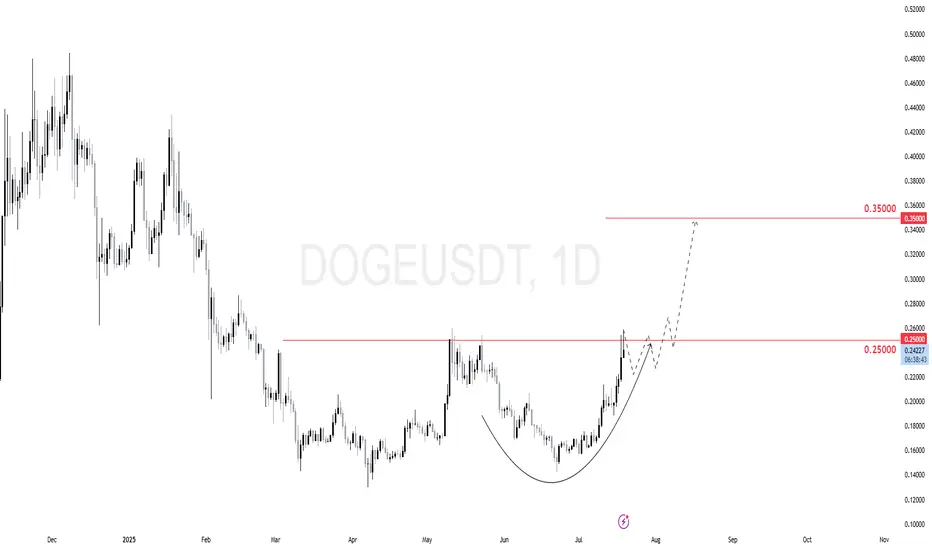
$DOGE (DOGECOIN) 1DDOGE just broke above the 0.25 key resistance.
The daily chart shows a clean cup-and-handle formation with a potential continuation setup.
Price might consolidate just above 0.25, creating a bullish base.
Then we expect a continuation move toward 0.35 as next target.
DOGEUSDT WEEKLY CHART | MY FAVORITEHELLO, DOGEUSDT
MEMECOIN my favoritoo
This is just my basic analysis. I see that DOGEUSDT Weekly looks very promising.
Why the Weekly? Because I’m aiming for the long term with DOGEUSDT — i'm Doge Holder..
Only patient people will reap the rewards of their efforts.
Remember, trading involves risk, and you are responsible for your own decisions — manage your finances wisely.

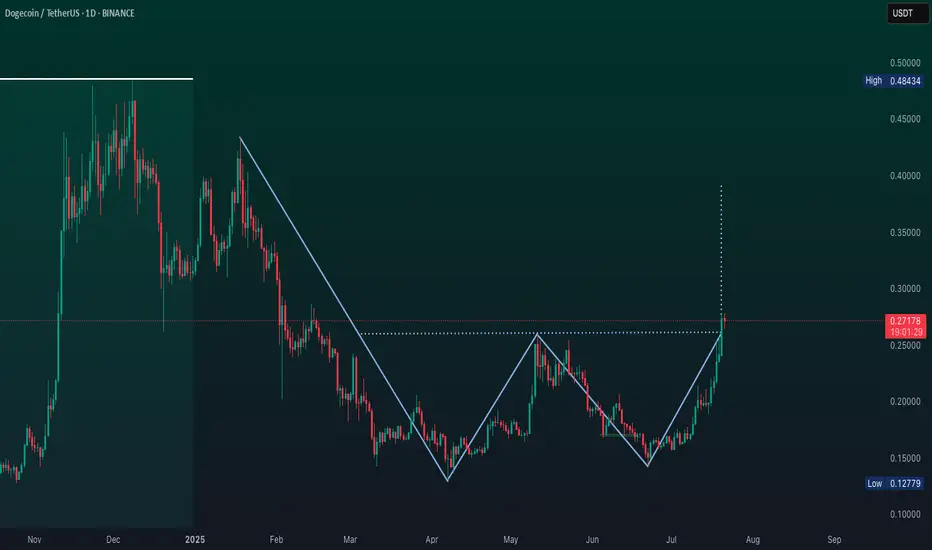
DOGE - Major W Reversal Pattern?Dogecoin (DOGE/USDT) is forming what appears to be a textbook W pattern on the daily timeframe — a bullish reversal signal that could indicate a strong upside move.
🔹 Key levels:
• Support: Around $0.12
• Resistance: Neckline at ~$0.26
• Breakout target: $0.40+
🔍 Pattern Insight:
This W pattern (double bottom) shows that sellers lost momentum, and bulls are stepping in. If we break and close above the neckline with strong volume, a rally toward $0.40 and above is on the table.
⚠️ Watch for:
• Break and retest of $0.26
• RSI confirmation
• Volume breakout
💬 Let me know in the comments — is DOGE getting ready for liftoff?
#Dogecoin #Crypto #TradingView #Altcoins #TechnicalAnalysis #DOGEUSDT #ChartPatterns
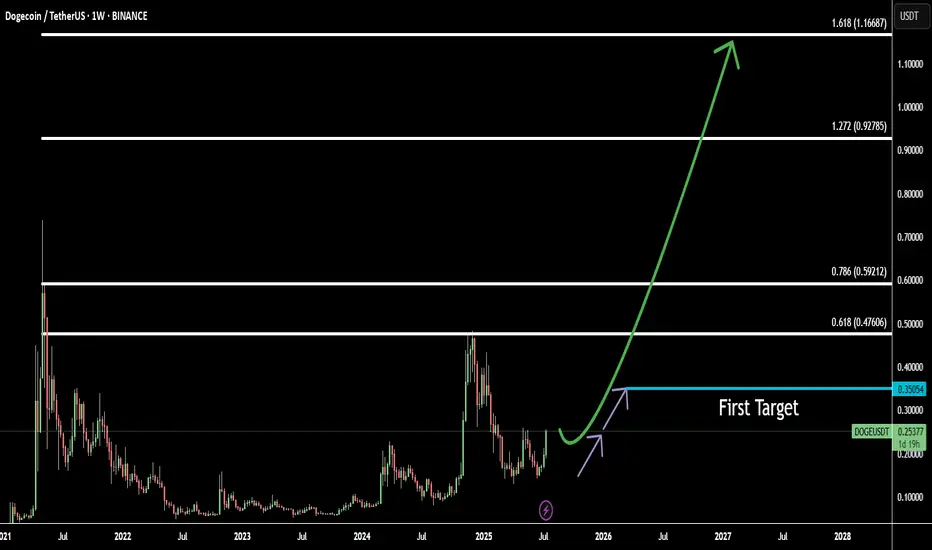
DOGE Weekly Double Bottom: Eyeing 5 Fibonacci TargetsDogecoin (DOGEUSD) is showing a bullish double bottom pattern on the weekly chart, suggesting a potential long-term reversal from previous downtrends. This classic accumulation pattern is forming near a key historical support level, adding confidence to the bullish case.
Using Fibonacci extensions from the neckline breakout, I’ve identified 5 major target zones:
Target 1: 0.35054 — conservative target confirming breakout
Target 2: 0.47606 — often hit during early momentum phases
Target 3: 0.59212 — key level for profit-taking and resistance
Target 4: 0.92785 — full measured move of the double bottom
Target 5: 1.16687 — aggressive bull target if momentum continues
The breakout is only confirmed if price holds above the neckline with strong volume. Risk management is crucial in case of a retest or false breakout.
DOGE - Another Perspective- DOGE is currently trading nearing the trendline resistance and pending breakout
- A clear breakout from this resistance line is a must to continue to bullish momentum.
- we will enter the trade after confirmed breakout
Entry: 0.221
SL at: 0.14103
TP1: 0.26035
TP2: 0.33892
TP3: 0.47751
Stay tuned for more updates.
Cheers
GreenCrypto

#DOGEUSDT: Swing Move In Making! Get ReadyThe cryptocurrency market is currently experiencing a rally due to the bullish trend of the underlying assets. The price has experienced a period of accumulation, followed by a distribution process. We have established a swing target based on the potential for the price to reach the previous record high. Technical indicators support our analysis, but we acknowledge the need for strong fundamental support to achieve this level.
We wish you the best of luck in your trading endeavours and encourage you to share our insights by liking and commenting on this post.
Sincerely,
Team Setupsfx_

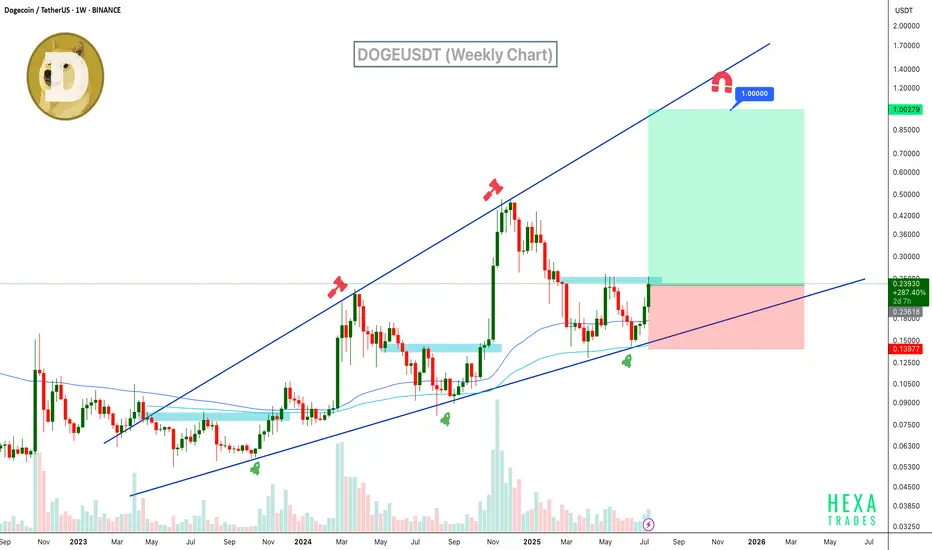
Will DOGE Hit $1? Ascending Broadening Wedge in PlayDogecoin is trading within a clear ascending broadening wedge on the weekly chart. The price has bounced strongly from wedge support and the 100 and 200 EMAs, now pushing upward with growing volume and bullish candles. If momentum sustains, DOGE could rally toward the $1 psychological target and broadening wedge resistance.
Resistance 1: $0.35
Resistance 2: $0.60
Resistance 3: $1.00
Stop Loss: $0.14
Cheers
Hexa
COINBASE:DOGEUSD BINANCE:DOGEUSDT
DO GE - Call the Ambulance!Okay DOGE thinks he is smart but he aint he will be taking hype and fall down and fall down in the place where no one can expect! Quasimodo in position!

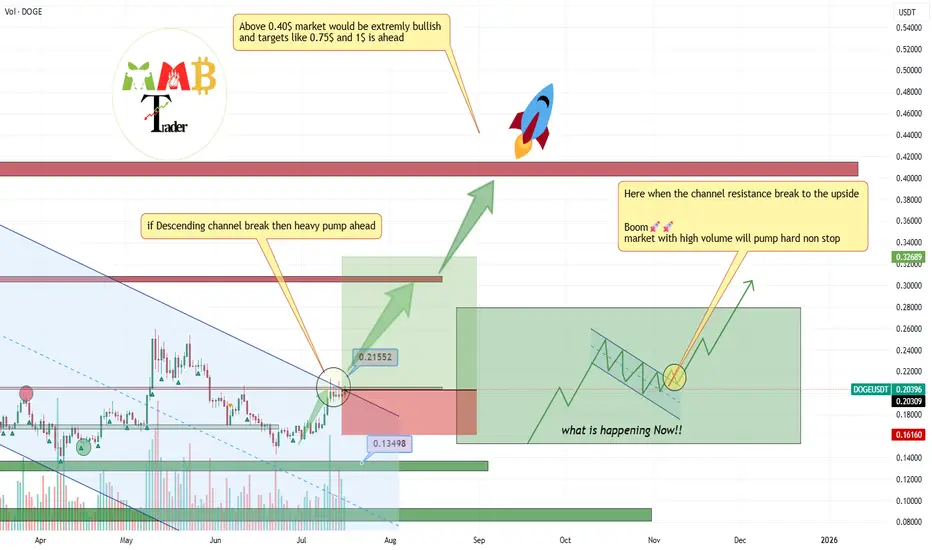
DOGEUSDT major breakout to the upside with at least 2x cookingThis breakout would be huge and it is happening now at least +60% gain is easy target so we put Take profit 1 there with our buy Setup which is 1:3(Risk:Reward).
Hope you all enjoy and it is time for BINANCE:DOGEUSDT to #pump this time and be a leader of MEME for weeks.
DISCLAIMER: ((trade based on your own decision))
<<press like👍 if you enjoy💚
$DOGE Double Bottom TargetIf this double bottom "W" pattern on CRYPTOCAP:DOGE plays out, the target is $0.47.
Two notes:
1. The double-bottom pattern has a 60-65% success rate (no guarantees).
2. The Alt market has been very strong, with new dollars entering the market. If we close above $0.25-0.26 and retest, I think this target is likely as it returns to the high for this cycle.

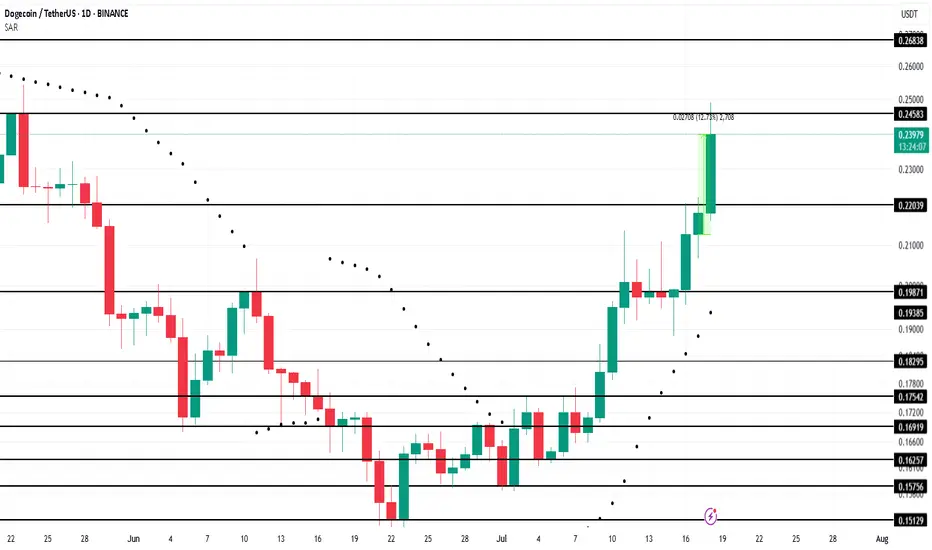
Dogecoin Leads Meme Coins With 12% Rally In 24 HoursBINANCE:DOGEUSDT , the leader of meme coins, surged 12% over the last 24 hours , reaching $0.239. This rally has positively impacted other meme tokens, showcasing DOGE’s influence within the market.
Currently facing resistance at $0.245, BINANCE:DOGEUSDT has reached a 2-month high . The Parabolic SAR below the candlesticks signals that DOGE is likely to maintain its upward trend in the coming days. If this support holds, the meme coin could continue pushing towards higher price levels, attracting more buyers and momentum.
However, meme coins are volatile. If BINANCE:DOGEUSDT holders decide to cash out their profits, the price could drop back down to $0.220 . Losing this support would invalidate the bullish outlook, signaling a possible downturn for the altcoin in the short term.