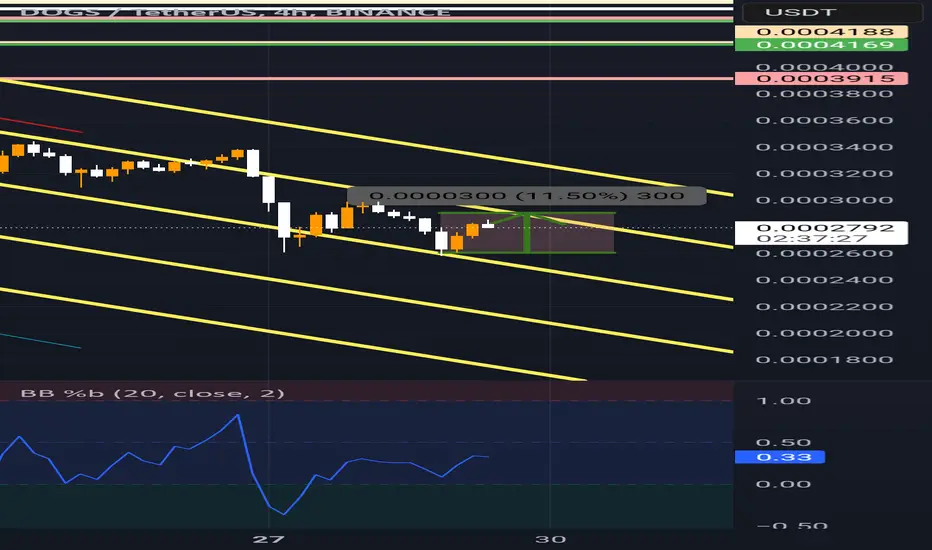
#DOGS/USDT Ready to go up#DOGS
The price is moving in a descending channel on the 1-hour frame and is adhering to it well and is heading to break it strongly upwards
We have a bounce from the lower limit of the descending channel, this support is at a price of 0.0002640
We have a downtrend on the RSI indicator that is about to be broken, which supports the rise
We have a trend to stabilize above the moving average 100
Entry price 0.0002860
First target 0.0003065
Second target 0.0003250
Third target 0.0003444
DOGSUSDT trade ideas

dogsusdtat the moment we got the lovest point my mean about 5% to lov level this key point show the main way at all in my idea short tp easily got
dogs analysis: risky position...hello friends
Due to the fall of this token, now that it is in a support area, we can enter into a transaction with capital and risk management.
*Trade safely with us*

DOGS token price for mid-term and expected targets for this yearthis is my new idea for this token
Unfortunately, things went worse than expected, and the bull season was delayed from normal, but let's look positively and remember that patience is the key
half a cent to 1 cent is the decent target for this token in the mid-term for this year
But there is a possibility of the price falling to the level of 0.00017 first
Good Luck.

Idea for dogsHello guys I have an idea for buying best meme token for ton platform
Dogs hame a small market cap and good exchange listing
Now price is cheap no risk for buying
Buy and hodl

DOGSUSDT DUMPING WILL ENDED AT 0.0002 and the target is 0.00068 Dear Friends,
In reply to one of my friend about DOGS, i think it touches 0.0002 and then an uptrend to 0.00068 afterward (17th March 2025).
The lower market cap. allows the market makers to play with new listed coins, and Dogs, as you can see in the chart , is one of them. so you may buy it at 0.0002 (1/3 spot) and in case of any lower price you may add with the target of 0.00068.
You may check other coins as XRP, DOGE, FIL, LINK, UNI etc. and wait to hunt DOGS at bottom price!.
good luck and my warm regards,

#DOGS/USDT Ready to go higher#DOGS
The price is moving in a descending channel on the 1-hour timeframe and sticking to it well
We have a bounce from the lower limit of the descending channel, this support is at 0.0003100
We have a downtrend on the RSI indicator that is about to break, which supports the rise
We have a trend to stabilize above the moving average 100
Entry price 0.0003300
First target 0.0003515
Second target 0.0003774
Third target 0.0004059

$DOGS Will Up if BTC Dominance Down. If you missed CRYPTOCAP:DOGE , now this is the time for $DOGS. The time that you have been waiting for.
I hope so.

DOGS: the last chance!hello guys!
Dogs is bearish so much!
and now it has its last chance to reverse! the Qml formed but the engulfed touched the S&Z after the pattern breakout! This puts the probability of a reversal a little bit in danger! otherwise, it remains bearish and continues to dump!!

dogsI think it's a good place to buy in the lower areas as long as the red lines aren't broken in the short term.

DOGSthis token is totally oversold, and most of all have also forgot about it that it exists...
keep an eye on this, could be very juicy pretty soon.
nfa
dyor

DOGSUSDTRisk warning, disclaimer: the above is a personal market judgment based on published information and historical chart data on Tradingview, all analysis is only subjective. Hope investors consider, that I am not responsible for your investment decision.
Thank you.
Good luck

DOGS Update"One of the hottest meme coins on the TON network (community-driven) is definitely SEED_ALEXDRAYM_SHORTINTEREST1:DOGS , which is currently on a downward Trend. Based on previous trends, we can start considering a step-by-step buying strategy. Moreover, don't forget that the TON blockchain is one of the best in the market right now, so any projects associated with TON and Telegram deserve our special attention. 📈💎"

What will happen to DOGE at the resistance line?📊 #Dogecoin is more likely to fall in the 4-hour timeframe until it is above the price of 0.35514, which is +6%.
🔼 There is currently a possibility of growth to this resistance for #Dodge.
🔼 Dogecoin’s key support is at -10% at the price range of 0.29980.
🕯 The analysis will be updated upon a support or resistance break.

dogsusdtat now we got 0.0004982
undoubtedly thats first tp got it in this senstive time really enjoyable
love this power dont forgot sl use this free tp got until next 50 hours love you all by me.

DOGS Approaching a trend reversal.For clarity, I’ll show everything on a line chart. There isn’t much to illustrate here: a descending channel starting from the listing, within which the most likely scenario is an extreme drop to the 3279-2665 area. This is the capitulation zone, from where a reversal is most likely to occur.
It’s also worth noting that volumes are already decreasing, which is a good sign of an upcoming trend reversal in the near future.

#DOGS/USDT Ready to go higher#DOGS
The price is moving in a descending channel on a 15-minute frame and sticking to it well
We have a bounce from the lower limit of the descending channel, this support is at a price of 0.0004664
We have a downtrend on the RSI indicator that is about to be broken, which supports the rise
We have a trend to stabilize above the moving average 100
Entry price 0.0004815
First target 0.0004915
Second target 0.0005065
Third target 0.0005222

#DOGS/USDT Ready to go up#DOGS
The price is moving in a descending channel on the 1-hour frame and sticking to it well
We have a bounce from the lower limit of the descending channel, this support is at 0.0005120
We have a downtrend on the RSI indicator that is about to break, which supports the rise
We have a trend to stabilize above the moving average 100
Entry price 0.0005350
First target 0.0005561
Second target 0.0005742
Third target 0.0006000

dogsusdtguys in this sensitive point we have this point easily 0.00062 i have this idea dont use this point without sl point at all good luck

DOGS (Beast will wake up soon)Hello my dears
Today we are talking about the meme of Telegram
Since the launch of this project of the giant Toon network
It has received wide attention from investors
Since the launch of the project there has been a great demand from investors for it
And we have entered a period of accumulation
I think the currency has formed a strong bottom
The targets are in blue
The last target can be achieved if the hype is large on Toon coins and may not be achieved
Book your profits with each target achieved
Good luck to you, my friends
If you like the idea, leave a nice comment like you
I wish everyone a lot of profit
May you be in good health and wellness

DOGS/USDT: Bearish Continuation or Relief Bounce Ahead?hello guys!
let's analyze Dogs!
Liquidity Sweep ("Hunted"):
A recent liquidity grab above the $0.0009000 resistance level indicates that smart money may have trapped late buyers before the sharp sell-off.
This bearish move aligns with the concept of liquidity hunting, where key levels are taken out before price reverses.
Bearish Momentum:
DOGS/USDT has broken below the mid-range support zone ($0.0006800-$0.0007000), suggesting strong bearish pressure.
The price is currently retesting this zone as resistance, a critical area for determining the next move.
Key Levels to Watch:
Immediate Resistance:
The previous support zone at $0.0006800-$0.0007000 is now acting as resistance. A rejection here could confirm a continuation of the downtrend.
Support Levels:
The critical support level lies at $0.0004500-$0.0004700 (purple zone). A break below this could open the door for a deeper correction toward $0.0003500.
Possible Scenarios:
Bearish Continuation:
If the price fails to reclaim $0.0006800, expect a drop to the major support at $0.0004500. A breakdown below this zone could trigger panic selling.
Short Position:
Entry: Near $0.0006800-$0.0007000.
Targets: $0.0004500, followed by $0.0003500.
Stop Loss: Above $0.0007300.
Long Position (Aggressive):
Entry: Near the purple support zone ($0.0004500).
Targets: $0.0006800, followed by $0.0009000.
Stop Loss: Below $0.0004300.

DOGS/USDT Near Oversold TerritorySEED_ALEXDRAYM_SHORTINTEREST1:DOGS /USDT is hovering near strong support at 0.0004800 after a sustained downtrend. RSI shows weak bearish momentum, with a potential for a rebound if support holds.
A breakdown below support could trigger further declines.
DYOR, NFA
