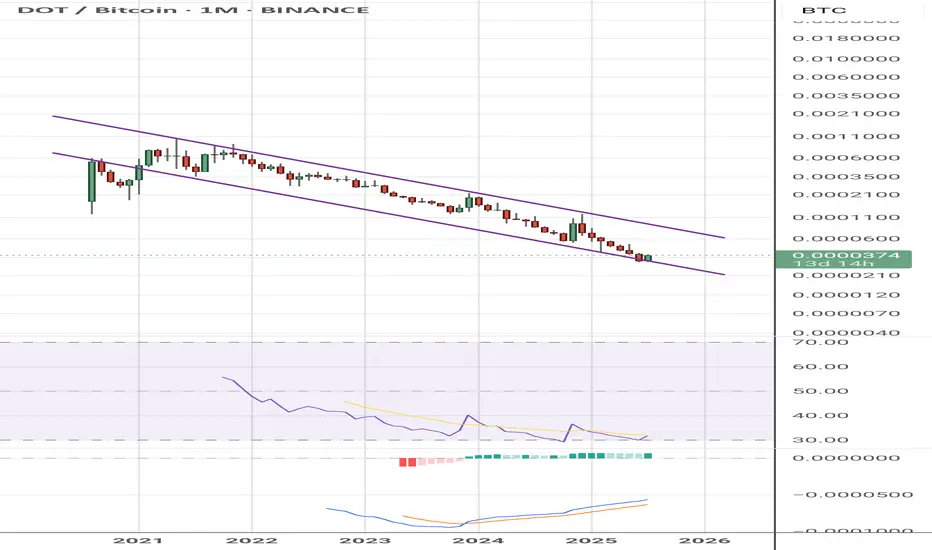
Polkadot reversal?Can you believe how much DOT has lost value against Bitcoin since 2021! Non stop price crash! Not forever!
Will Polkadot start reversing?
I don't think DOTBTC will return to all time high but you could easily 5-10X your BTC.
Let's see!
Related coins
Move your BTC to DOT Hi,
I think it's a good time to convert part of your BTC to DOT.
I would move 50% of my BTC portfolio to DOT right now.
This is just for fun, to hit play on the future and see how correct or wrong I was :)
Thanks!
Polkadot Vs Bitcoin —Augmented Reality—1,000X Better Than Fiat!DOTBTC peaked in May 2021, it will soon be exactly four years.
The bear market bottom and lowest price was hit 3-February 2025. This week, we have a double-bottom.
A double-bottom is a bullish signal and points to a change of trend. There is another bullish signal hidden within this signal.
The lo

Another fallGiven the past trends, there's an overwhelmingly high probability that we will witness another 50% drop or even the complete demise of DOT. It seems like everything is spiraling out of control, and there’s little hope left for any positive outcome. This could very well be the end.

How polkadot Version 2.0 Will Eliminate CompetitorsWhy Polkadot is the Best Blockchain and How Version 2.0 Will Eliminate Competitors
As blockchain technology evolves and numerous networks emerge, the need for a system that can connect and optimize collaboration between them becomes increasingly essential. Polkadot is one of the most advanced and pr

DOT - BIG PUMPDear My friends,
I may have overlooked DOT. Watching BTC's strong growth in recent days, alongside the major coins soaring, I’m reminded of XRP from my previous analysis—it has broken out and is on the rise. As I continued to evaluate other coins, I noticed DOT in comparison to BTC. I discovered a

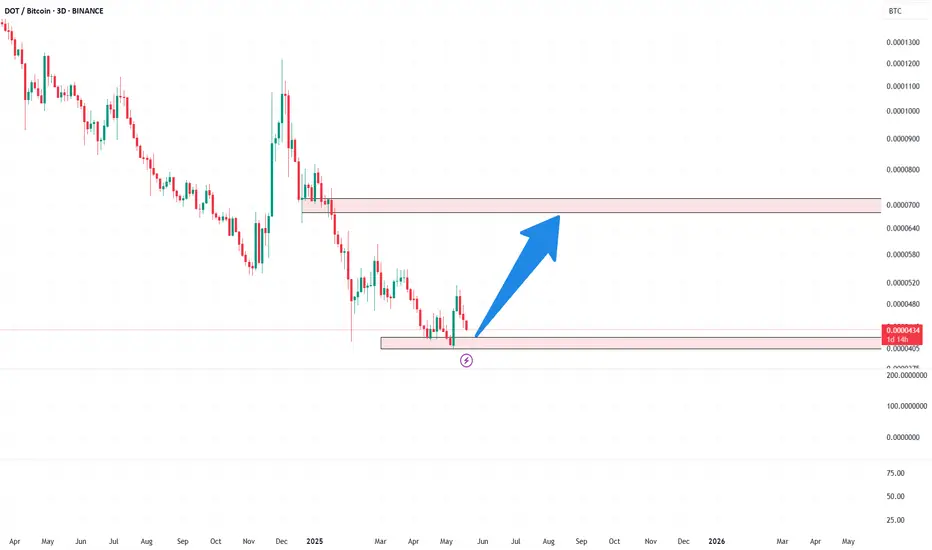
Possible DOT journey in the next monthsIf DOT closes (green candle) above the first PINK box, then the journey to the way up will start for DOT.
Possible targets are marked in the pink box.
Notice that we first need the first lower pink) box to be crossed.
Later I have displayed possible targets. It does not mean that it will reach t

Sell Signal for DOTBTCWe have identified a Sell opportunity for the DOTBTC trading pair using our EASY Quantum Ai strategy.
Trade Details:
- Enter Price: 7.35E-05
- Take Profit: 7.187E-05
- Stop Loss: 7.527E-05
Analysis:
Our prediction is based on recent market analysis and the unique capabilities of our

Polkadot: No Bottom Confirmed (Professional Level Trading)Here is a chart where we do not have a bottom. We do not have a bottom pattern and no reversal signals. There is no bullish breakout, no rising volume, nothing. We can find something by looking at some indicators but all these signals would be weak.
Now, consider this, how far lower can it go?
We'


See all ideas
Summarizing what the indicators are suggesting.
Oscillators
Neutral
SellBuy
Strong sellStrong buy
Strong sellSellNeutralBuyStrong buy
Oscillators
Neutral
SellBuy
Strong sellStrong buy
Strong sellSellNeutralBuyStrong buy
Summary
Neutral
SellBuy
Strong sellStrong buy
Strong sellSellNeutralBuyStrong buy
Summary
Neutral
SellBuy
Strong sellStrong buy
Strong sellSellNeutralBuyStrong buy
Summary
Neutral
SellBuy
Strong sellStrong buy
Strong sellSellNeutralBuyStrong buy
Moving Averages
Neutral
SellBuy
Strong sellStrong buy
Strong sellSellNeutralBuyStrong buy
Moving Averages
Neutral
SellBuy
Strong sellStrong buy
Strong sellSellNeutralBuyStrong buy
Displays a symbol's price movements over previous years to identify recurring trends.