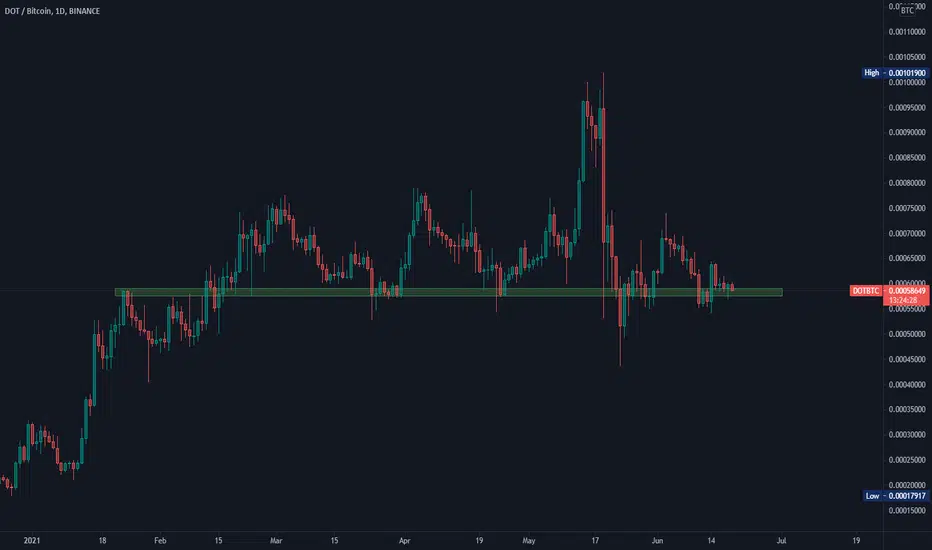
$DOTBTC Hinting capitulation and upcoming strong reaction.Huge sparse falling wedge, approacing historical static support sitting close to the 0.00018 mark.
Good spot for accumulation on further weakness, R:R. 2:1+.
Long term trade, 0.0004 target (x2). For starters.
To be re-evaluated in 3-6 months.
DOTBTC trade ideas

dotdot/btc
step by step i will try to share my ideas, but i like to see the s2 first
then start to test the resistance 1 by 1
also angel 1 changed to 2
share your ideas with me
tnx.

bearish scenario DOT/BTC TF 8Hthis is the bearish scenario my analysis, please give me feedback about it and what do you think about it :D

My Idea on DOT/BTC TF 8H I am thinking about my analysis, i need feedback about how people see also, please give me feedback about this :D

Polkadot (DOT) formed Gartley | A good buy opportunityHi dear friends, hope you are well and welcome to the new trade setup of Polkadot (DOT) with Bitcoin pair.
On a 4-hr time frame, DOT has formed a bullish Gartley move.
Note: Above idea is for educational purpose only. It is advised to diversify and strictly follow the stop loss, and don't get stuck with trade

DOT RANGEThe price is at the bottom of the range, where we have confluence, with the Golden Pocket+ VAL of the range. After some SFP action, it has chance to visit the middle of the sideways range again , wich is in the same area with the top of the descending channel, and the Range Poc.
DOT Long on BTC pair- downtrend break;
- ascending triangle formed;
- riding 1D MA100
what's not to like..? :)

DOT/ BTC Main trendMain trend. Logarithmic graph. Timeframe 1 week.
A huge harmonious pattern is formed, with impressive target.
Very relevant work on this pair will be in the first place when bitcoin is “bad”.
The % growth / fall of the price in the event of the development of certain price movements (breakthrough / no breakthrough, fixing / not fixing) relative to key levels and zones is shown on the chart.
The same indicators on a line chart.
Secondary trend
DOT/BTC Secondary Trend

DOTDOT/BTC RSI is breaking out. Chart looks less clear...
Seems to me Alts are breaking out...
Against what everyone thinks...seems like max pain is up.

DOT vs BTCComing to end of the bowl and we had a false breakout yesterday which created a bearish hammer.
Also a bump and run pattern suggesting we'll break the bowl and 0.00066.. ratio.
Bullish RSI divergence as well.

DOTBTC - SELLHello traders, I'm going to sell DOT for BTC because if we go into a retrace with bitcoin, I predict based on history that BTC will again grow faster than altcoins and therefore I am open to the possibility that BTC will be much more beneficial to me and in addition, we can see here that there is a beautiful downtrend, so after the analysis I found out that the trend is also on our side.
I personally prefer setting up multiple TPs , here's an explanation:
1) 1:1 allows you to take a 50% position and thus secure a balance against loss in case the market turns
2) 2-5 :1 means profit (25% trade volume ), after reaching this TP I move SL to BE
3) 5-10 :1 means bonus money with rest of trade volume 25%
In this way, I ensure that my equity curve grows consistently without significant dips.
Money is lying on the ground, just bend down for it! Be patient and wait for the price to reach a strong zone and open a position!
If you like my analysis, give a follow, I'm going to do it regularly every day!


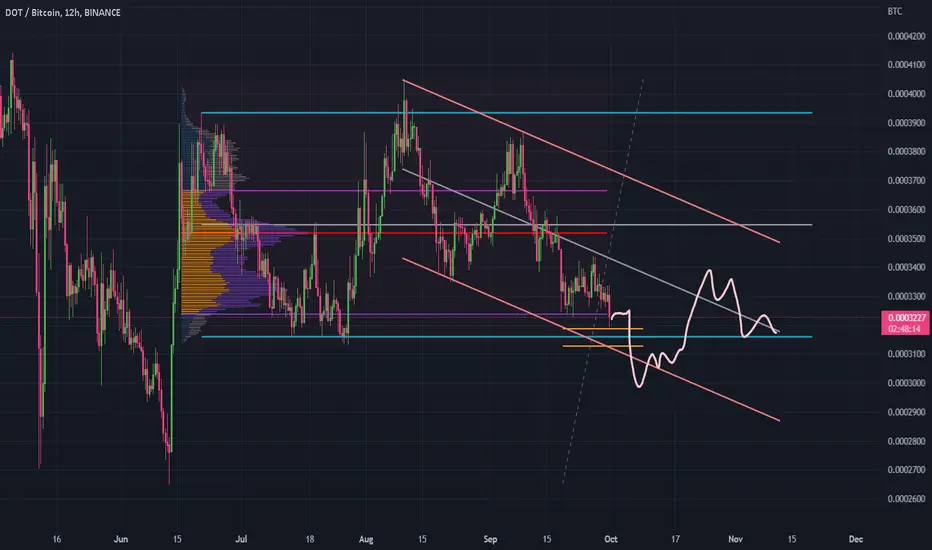
DOT/BTC Secondary TrendSecondary trend. The graph is logarithmic. Timeframe 3 days. A falling wedge is forming in this secondary trend.
The % growth / fall of the price in the event of the development of certain price movements (breakthrough / no breakthrough, fixing / not fixing) relative to key levels and zones is shown on the chart.
The same indicators on a line chart.
Main trend.
A huge harmonious pattern is formed, with impressive target.
DOT/BTC Main trend

[Watch it] DOTBTC 2W hints possible upcoming recovery2W is a pretty high TF, good for long term positioning if you have PATIENCE.
I see a bullish divergence on W and a strongly oversold Stoch RSI on 2W.
Flattening MACD, pretty far from SAR.
Looking forward to confirming signals within next few weeks / months.

DOT - is starting to outperform bitcoin !!As many altcoins, DOT has started to clearly outperform Bitcoin !!
Will be interesting to see how this further develops ....

DOT/BTCDOT is performing a lot better than other alts! even better than ETH! ETH's dump could be related to DeFI as well but this strength shown in DOT/BTC call for a strong pull back . easy 30-40%


DOTBTCbullish cfork
btc.dominance looks bearish
24% on offer here vs btc if we can bounce the btcrpice and totalcaps
dot eco coins bullish movr glmr astor all looking strong
dxy bearish and continuing to look so
alts nuked like crazy total 3 completely capitulated druing the luna incident
parachain still underated..
could be a generational long opp if the market returns bullish this year.
high risk out there rn tho be careful

#DOT/BTC 1DAY UPDATE BY CRYPTOSANDERS !!Welcome to this quick DOT/ BTC analysis.
I have tried my best to bring the best possible outcome in this chart.
Reason of trade:-DOT/ BTC PARALLEL CHANNEL and buy the green zone and (SPOT CALL)
Entry:-0.0003000,0.0003333
Traget:- 50%
Stoploss:- 0.0002722
Remember:-This is not a piece of financial advice. All investment made by me is at my own risk and I am held responsible for my own profit and losses. So, do your own research before investing in this trade.
Sorry for my English it is not my native language.
Do hit the like button if you like it and share your charts in the comments section.
Thank you...

DOTBTC - HTF Elliot Wave PerspectiveTriangle into X - very bullish and currently the more likely count given the long-term bullish market structure.
or
ABC into X and much lower targets - bullish in the long-term.

Polkadot is going to rise highAs you can see from the daily chart Polkadot / BTC has made a bottom and has a huge pottential to rise up soon. Of course BTC moves will be important to follow.
Of course this is not a financial advise,((trade based on your own decision ))
<>

Polkadot looking interestingPolkadot (DOT) has been quiet for a while vs BTC--but that's often when the best opportunities present themselves. Negative momentum appears to be slowing and I'm seeing Bullish Divergence on the Daily chart. Having said that, I'm still expecting a retest of the Trend Support and that's where I would look to start averaging into a long position. If Support breaks, I'll be looking at 3500 sats for another buy opportunity.
Happy Trading.
----------------------------------------------------------------
These are my personal views and not financial advice. Please do your own research before investing.
I'd love to hear your thoughts, ideas and feedback. Feel free to Comment and I'll try and get back to you quickly.
If you appreciated this analysis, consider Liking or Following . Thanks!
