DOTUSD.PM trade ideas

DOTUSD PolkaDot Down on Weekend.DOTUSD PolkaDot Down on Weekend.
OrderBlock on top.
Seeing sharp edges.
Short to aim 5x.

PolkaDOT shake outGreat pump this morning.
Took some profits rebutting back in now.
I'm still seeing a pump coming. Possibly above $14 before the end of the year or by late January.
NOT FINANCIAL ADVICE
Dot/usdt analysis by ictAccording to the existing volume imbalance gapes (VI) on the prices of horizontal lines dot price must fill this gapes with price and tick this targets:
Tp1: 10$
Tp2: 22$
Tp3: 40 $

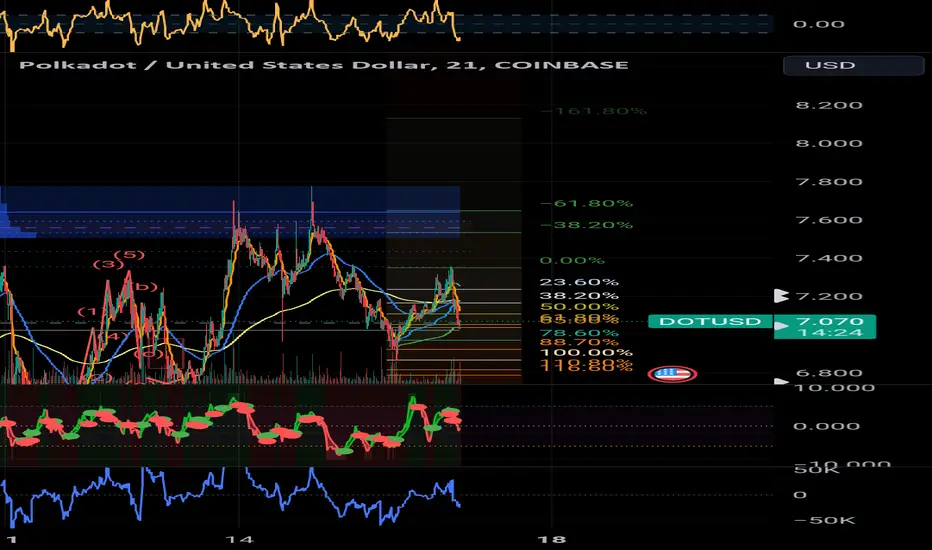
POLKADOT: +100%! What's Next?In our last analysis, we identified that we were in a 535 zigzag pattern. We had a bullish setup on the completion of wave B (subwave C). We moved up perfectly and gained over 100% raw gain from that trade!
We are now at a critical zone. We are looking for a rejection here and then a move down to complete the major ABC zigzag pattern.
Trade Idea:
- Watch for rejection of structure
- Safe entry on break of red trendline
- There may be a risk trendline lower timeframe so do keep a look out for that
- Targets: 3.6, 2, taper positions thereafter
Goodluck and as always, trade safe!
See our last analysis below:

POLKADOT - Higher Timeframe Overview ✨Polkadot is currently within a correction (Wave B). Wave B is made up of 3 subwaves and we are currently in subwave B and expecting subwave C.
We currently do not have a bottom in place so the best we can do is look for lower timeframe trendline break and reversal patterns.
See our next post for lower timeframe analysis.
Goodluck and as always, trade safe!

PolkaDOT PAYING MEIn and out within seconds.
MY DAY IS PAID FOR!!!
This is dangerous to play with 50% of the account.
NEVER BUY THE BOTTOM & NEVER SELL THE TOP!
Let us get this money!!!
15 second time frame trading and also I have this STAKED.
SOO it is in my interest to pump my own coins while the numbers bring attraction to my coins.
Keep the pump alive!!!
pOlKaDoT!!


DOTUSD - In SidewaysDOTUSD in sideways zone. I'm going to take the benefit of this zone and place a sell limit order for a short position. What do you think? Tell me in the comments below. Thanks
My Positions
Sell Limit : 5.70
Stop Loss : 5.90
TP1 : 5.50
TP2 : 5.30

DOT Future Outlook 🚀One cryptocurrency that is lagging behind in my opinion is Polkadot.
Our last limit order for DOT didn't get filled. After close scrutiny, it appears to be a completed Wave (a), with the formation of Wave (b) underway or just completed. There might be a brief upward move, but I don't anticipate it surpassing the level of Wave 1. A Flat pattern, whether Regular or Expanded, seems likely, potentially for wave (c) retracing precisely to the wave (a) level or just below it.
Considering this as a Wave 2 scenario, a wide stop-loss is advisable for added safety. A target around $7 would represent a 50% retracement, while pushing to $8 could mean a 67% gain. 📈

tinne wenne polkadot bikini wavewave 5 already started while ago, price should continue to around 8
nfa
y axis only

Will Polkadot ($DOT) ascend to $8? DOT price showcases a channel breakout rally, hinting at a potential reversal.
Golden crossover of the 50D and 200D EMA signifies increasing bullish sentiment.
Bullish continuation may propel DOT price towards $8 if the uptrend maintains momentum.
Recent climb marks a strong comeback for Polkadot, surpassing key levels.
Recent recovery after a 52W low at $3.56 resulted in a 53% return in 44 days.
Positive signals of trend reversal strengthen sentiment around Polkadot.
Current DOT price trades at $5.45, showcasing a 6.21% overnight jump.
RSI indicators signal growing momentum towards the overbought boundary.

DOT → Rocket to the Upside? This Simple Analysis Answers That!DOT reversed from $5.88 into a bear channel on November 11th and had three pushes down that ended 10 days later. This point of impact included contact with the 200EMA which resulted in a large bull bar closing near its high. So is the bear channel over and this bull flag play out?
How do we trade this?
The current price area is crucial to whether or not we long here. If this bar closes on or near its high it will be yet another strong bounce off of the 200EMA forming a higher low. Such an occasion gives us enough justification to enter a long position, placing a stop below the 200EMA and targeting the previous high when the bear channel started.
It should be noted, that the price is below the 30EMA and the bear channel resistance, so watch out for resistance at these levels. Be prepared to either take some profits at the bear channel resistance or get out if the price action begins to show signs of reversal, such as strong bear candles closing on or near their lows.
Taking selling half of your position for profit at bear resistance gives you about a 1:1 Risk/Reward. You could move your stop loss up to break even, and then you've locked in profits. The remaining half of your position becomes a bonus at the 1:3 Risk/Reward, which should allow you to make more rational decisions in your trade management.
Trade Idea
Long Entry: $5.14
Stop Loss: $4.92
Take Profit: $5.80
Risk/Reward Ratio: 1:3
Key Takeaways
1. Bear Channel/Bull Flag, Look for Long Entries.
2. Three pushes down, Bear Capitulation Candle on the Third.
3. Strong Bull Response on 200EMA, Reversal Evidence.
4. Currently forming a higher low, wait for the Candle to Close.
5. RSI coming up from 33.00, Bias to Long.
You are solely responsible for your trades, trade at your own risk!
If you found this analysis helpful, click the Boost button and let us know what you think in the comment section below!

DOTUSD LONGIf you thought the bears in this market went into hibernation you thought wrong. This is a clear correction, but the idea that the bulls have this market is simply repugnant. From where we are you can see that there was a point in previous structure where there was some crazy wick action which indicated a vector push to the downside (highlighted in the white rectangular box) which clearly didn't last that long. Knowing that this move from the 9th of November indicated and even incentivize some short selling to inter the market, it is was be a safe assumption that some retailers and even institutions still have liquidity at this keep level that has potential to still be mitigated. Lets watch and see how long this last.
Keep in mind I am long term bullish on this project and price could turn around at any moment in time. We are right now looking at a zoomed in look of this overall chart reflecting the 4H timeframe. If we zoom out and mark up your chart on the weekly you should be able notice that price in currently below the 88% of OVERALL structure and that this is typically where people look to buy. but we should see another drop below the previous low to create an opportunity for the bull to poke the bear!!!!
USE PROPER RISK MANAEGMENT


DOT Price Soon To Cross $5.50Bullish Breakout Rally: DOT price shows a bullish breakout, reclaiming the $5.50 mark.
Positive EMA Crossover Event: The bullish influence on the 50-day and 200-day EMAs suggests an upcoming positive crossover.
Potential Price Jump: A successful move beyond $5.50 could propel DOT price towards $7.
Strong Comeback in October: DOT experienced a significant recovery from its support level of $3.56 during the late October rally.
200D EMA Surpass and Psychological Mark: Polkadot's recovery rally surpassed the 200-day EMA and regained the $5 psychological mark.
V-Shaped Recovery: DOT highlights a sharp V-shaped reversal from its 52-week low, indicating a strong recovery.
Intraday Trading Volume Surge: An increase in intraday trading volume supports the bullish trend.
Challenging Overhead Supply Zone: DOT's uptrend is currently testing the overhead supply zone at $5.50.
Current Trading Price: DOT is trading at $5.39, with buyers attempting to overcome the $5.50 resistance.
Recent Pullback and Market Influence: A recent pullback in Bitcoin's price to FWB:36K , resulting in market liquidations, has influenced DOT's trend.
Technical Indicators: The daily RSI is near the overbought boundary, supporting the breakout thesis, while EMA trends indicate bullish momentum.
Market-Wide Recovery and ETF Anticipations: The overall market recovery and ETF approval anticipations are key factors influencing the rally.
Price Range and Support Levels: If DOT surpasses $5.50, it might reach $6, while a downtrend could retest the 200-day EMA at $4.88.

PolkaDOT cup and HQuick idea GOOD or BAD we will know soon!
NOT INVESTMENT ADVICE!!! IT CAN GO TO ZERO!

PolkaDOT bags are packed!!Heading out of the range before the others?
She has been winding up!!
I bet a lot of people walked away in the last two days with the price action.
What are I going to be wearing on the beach???
Yep you guessed it POLKAdotS
THIS IS NOT FINANCIAL ADVICE. ITCAN GO TO ZERO!!


DOTUSD request analysisThis chart are update from my previous analysis.
Right now DOT still channel up pattern, and already touch fibonacci support at channel up support, and broken channel down pattern with a strong candle.
Bullish will continue to reach previous resistance at $5.74
and we also have new bullish target at $6.41 as fibonacci 1.618 projection
*I draw path line, if $5.74 still hold bullish, our new support level at channel up support.

DOT Weekly Analysis - Are We Going to $5 or $15!?DOT broke out of its descending wedge pattern last week with a bull bar closing near its high, a strong breakout bar. Since then, the price has pulled back to the 30EMA, but will it hold?
Bitcoin is currently pulling back from its Weekly bull channel resistance as depicted in my Bitcoin 4HR and Weekly analysis. DOT will likely follow its lead with the broader market sentiment and pull back to the top of the descending wedge. If you're looking for a long, you could fade your position from here to the $5 mark and wait for a buy signal and a strong bull confirmation bar closing near its high. For the next couple of weeks, I expect the price to pull back and drip toward the downside.
Key Points
1. Breakout from Descending Wedge!
2. Pullback to 30EMA
3. Pullback may continue to the top of the wedge.
4. Bitcoin Leading Indicator, Pulling Back
5. RSI is just above 50.00, Room to Fall
You are solely responsible for your trades, trade at your own risk!
Let us know what you think in the comment section below!

DOTUSD support and Resistance levelPolkadot still solid inside channel up pattern, this is a great progress for bullish.
This week DOTUSD try to break resistance 1 level, but it failed and almost reach channel up support.
Target from channel up support at resistance 2 at $5.06 with maximum target at resistance 3 at $5.69
If channel up pattern break down, Polkadot still have fibonacci support at $4.05 to hold bearish movement
If you have any question about this analysis, let me know at comment below.

PolkaDot Possible Bull TrapPolkaDot Possible Bull Trap
Left a wick on top to leave a mark.
If it works its a 3 to 5x move.
Stop is here to save us.
