DOTUSD - Cup and handle filled with green candles tea ?Very simple trade idea ?
my average is around 4.5 and will leave next month probably
for now at very good support (0.236 fib + previous high)
can go more down to test that black trendline for example but at the end the target is 6.5 in a few days/weeks
stop loss depends if btc goes under 95.8
cheers
DOTUSD.PM trade ideas

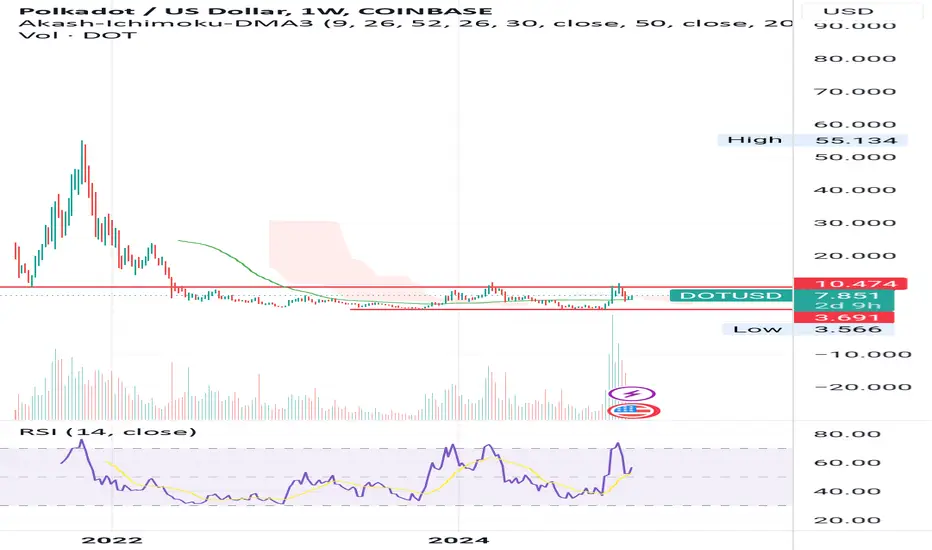
Polkadot: Back on the Rise?Following the recent sharp pullback, Polkadot has established an important low just above the support at $3.56, completing the orange wave ii. In the medium term, the subsequent orange impulse wave iii should drive the price significantly higher, breaking past the resistance at $11.88. However, if DOT falls below $3.56, our 39% likely alternative scenario will come into play, and the magenta wave alt. will reach a new major correction low. For this case, we have outlined our orange alternative Target Zone between $2.40 and $1.07.

More downside expected before higher prices on DOTCurrently I'm holding 672 DOT coins long term with average price of 6.9$. I plan to add more at 3.6$. Why?
Dot like majority of cryptos has been dumped on last sunday and we saw a big pumps up on monday, but potential for more downfalls are expected in my opinion. Also this is how markets move. Primary push up will often be taken out to liquidise long positions and only then markets will go up higher.
If support at 3.6$ will be taken out expect even lower prices and in this case it can take a long time for prices to go up.
For targets look at previous highs first at 6.5$ then at 12$ and potentialy higher up to 15$.

DOT A CHANCE TO 100% GAINSee the demand zone we are in now! If we can see a turn around from here, we can easily do a 100% Before end of 2025!

DOT/USD Downtrend Continues – Will Support Hold ?
Currently, the price is in a correction phase, declining from its peak.
The price is near the lower Bollinger Band, indicating oversold conditions.
The bands are contracting, suggesting lower volatility.
If $5.50 support breaks, price could decline towards $5.00 or lower.
A test of $3.60 could occur if the bearish trend continues.

Shorting DOT hereShorting the weakest names in the face of general softness in the crypto market (if majors surprise with strength, it will take longer for weak names to hunt stops)

DOTUSDTRange Breakout: The pair has been trading within a range, and the breakout from this range signals potential bullish momentum. A breakout indicates that the price is ready to move out of its consolidation phase, with buyers now in control.
RSI Bullish Divergence: The Relative Strength Index (RSI) indicates a bullish divergence, meaning while the price was making lower lows within the range or downtrend, the RSI was making higher lows. This suggests that selling momentum is weakening, and buyers are starting to gain strength.

Polkadot will hit a new ATH soon (2D)Before anything, pay attention to the analysis timeframe: it’s a 2-day timeframe and requires patience.
From the point where we placed the red arrow on the chart, it seems Polkadot's correction has begun.
This correction appears to be a triangle. We are currently in the middle of wave D.
Polkadot, by feeding on the demand orders marked on the chart, can move toward the red box to complete wave D.
After completing waves D and E, it can move toward the historical peak and create a new ATH.
The closure of a daily candle below the invalidation level will invalidate this analysis.
For risk management, please don't forget stop loss and capital management
Comment if you have any questions
Thank You

Time capitulationCan you please be a gud coin and go up? Polkadot seems ready for something, sellers exhausted, holders exhausted - time to go up pretty master of all chains.

Polkadot Accumulation ZoneThe concept of an "accumulation zone" in cryptocurrency, like with Polkadot (DOT), refers to a price range where a significant amount of buying is occurring, often by long-term investors or "whales" who believe the asset is undervalued or poised for an upward price movement. Here's how it relates to Polkadot based on available information:
Seems CRYPTOCAP:DOT is holding up in the accumulation zone with a bullish RSI getting ready for a move in the coming week. The Green Zon is the RSI Low using an RSI 7-period respecting the low zone Accumulation might be occurring here. Most Crypto assets have similar zones happening. Just looking at the bar patterns it's hard to see but with the RSI indicator, it looks positive to me.

DOTUSD - at Key zone - Could it reach 7.100?COINBASE:DOTUSD is in a robust support zone, with previous strong buyer interest. The recent bearish pressure has brought the price into this tageted zone, creating a potential buying opportunity for me.
With the confirmation in place, I anticipate a move toward 7.100. However, a breach of this support could invalidate the bullish move and lead to further declines.
Traders should carefully assess price action at this level and ensure proper risk management before taking positions.

DOTUSD Plunge Alert Precision Short Targeting 10%+ Gains !The asset, DOTUSD, is showing a sharp bearish momentum with a decline indicating strong selling pressure.
The current price is 6.905, while the short entry position aligns with a retracement after a peak profit zone
1. Trend Direction
The price has broken below green channel, signaling a trend reversal from bullish to bearish.
Red zones around the moving averages confirm the presence of downward momentum.
2.Entry Confirmation
The short position appears to be placed after the market failed to hold its highs (Peak Profit 10.14%) and created lower highs, validating the short trade setup.
Entry aligns with the rejection of resistance levels, suggesting a good risk-to-reward setup.
3. Risk Management
Stop-loss is placed slightly above the sell zone, covering the recent swing high. This limits risk in case of price retracement.
The profit target extends well below the entry, suggesting confidence in further downside potential.
4. Aetos Indicators
A potential momentum-based or moving average indicator is being used to highlight peak profit areas, confirming optimal trade execution.
The bearish engulfing candles in the sell region validate the short bias.
Projection
Target Zone: The profit target aligns with the 6.230 support level, indicating expectations of a 10% drop from the entry point.
Downside Risk: If bearish momentum continues, there could be a breakdown below 6.230, extending losses toward 6.000 or lower.
Analysis
DOTUSD is experiencing a sharp bearish reversal after failing to hold its highs. The short entry capitalizes on lower highs and rejection near the resistance. Stop-loss is strategically placed above recent highs, while the target aligns with key support levels. This trade setup is supported by
Bearish momentum.
Clear breakdown below the moving average channel.
High risk-to-reward ratio for short-term traders.
Strategy
Stay short below 6.905, targeting 6.230. If price retraces above 7.00, consider exiting the position. Always book profits partially and move SL to BE

How To Find Bullish Squeezes : TutorialI go over order flow, levels, and how to find good entries by quickly locating bullish squeezes using one free indicator in Trading View by simply eyeballing charts.

POLKADOT - Buy Idea (Medium-term)The Polkadot had been bottoming out right off the last line of local support at $6.86, and is starting to turn around. This is a strong indication that price action is gearing up for an upside reversal. A new bull cycle will propel price action back to the levels it came from. We're issuing a new bullish campaign, targeting the key-level resistance of $9.82. Stay tuned...

LONG DOT here for a move to $23Polkadot break and retest of downtrend from 2023. Lots of dev activity onchain, great nakamoto coefficient - this is the most decentralized smart contract platform without question. As we start to see advertising and ETH/BTC pushing higher, it's my belief that DOT will be one of the star players in the L1/DEFI narrative.

Potentially bullish for #DOT. If the price breaks out of the breakout level, the target is the resistance level. If it breaks through this level again, price targets of $43.31 can be expected during this bull run for #DOTUSD.

polkadotso much has gone into pushing price higher in such a way that if it ever reach 7.00$. it may continue to go lower for a long time before the market ever changes. im optimistic about this move. because most of the coins today are experiencing pullbacks and it is always a good indicator to buy at lower prices again. look out for any inner change of structures that will signify the pull back is over. target will be up to an estimated time and value of 8.2 by tommorow or the day after. following btc sentiments of course and political and economic news.

DOT/USD "Polkadot vs USD" Crypto Market Bullish Heist Plan🌟Hi! Hola! Ola! Bonjour! Hallo!🌟
Dear Money Makers & Robbers, 🤑 💰
Based on 🔥Thief Trading style technical and fundamental analysis🔥, here is our master plan to heist the DOT/USD "Polkadot vs USD" Crypto market. Please adhere to the strategy I've outlined in the chart, which emphasizes long entry. Our aim is the high-risk Red Zone. Risky level, overbought market, consolidation, trend reversal, trap at the level where traders and bearish robbers are stronger. Be wealthy and safe trade.💪🏆🎉
Entry 📈 : You can enter a Bull trade at anypoint,
however I advise placing Buy limit orders within a 15 or 30 minute timeframe. Entry from the most recent or closest low or high level should be in retest.
Stop Loss 🛑: Using the 4H period, the recent / nearest low or high level.
Goal 🎯: 10.500
Scalpers, take note 👀 : only scalp on the Long side. If you have a lot of money, you can go straight away; if not, you can join swing traders and carry out the robbery plan. Use trailing SL to safeguard your money 💰.
Warning⚠️ : Our heist strategy is incompatible with Fundamental Analysis news 📰 🗞️. We'll wreck our plan by smashing the Stop Loss 🚫🚏. Avoid entering the market right after the news release.
Fundamental Outlook 📰🗞️
Considering these factors, the DOT/USD pair may experience a Bullish trend in the short-term, driven by:
Increasing adoption and usage of DOT, driven by its interoperability features and growing ecosystem.
Improving blockchain development and scalability.
Growing developer interest and user adoption.
Bullish Factors:
Increasing adoption and usage of DOT, driven by its interoperability features and growing ecosystem.
Improving blockchain development and scalability.
Growing developer interest and user adoption.
Potential for increased institutional investment and mainstream recognition.
Competitive advantages over other cryptocurrencies, such as faster transaction times and lower fees.
Please note that this is a general analysis and not personalized investment advice. It's essential to consider your own risk tolerance and market analysis before making any investment decisions.
Take advantage of the target and get away 🎯 Swing Traders Please reserve the half amount of money and watch for the next dynamic level or order block breakout. Once it is resolved, we can go on to the next new target in our heist plan.
Keep in mind that these factors can change rapidly, and it's essential to stay up-to-date with market developments and adjust your analysis accordingly.
💖Supporting our robbery plan will enable us to effortlessly make and steal money 💰💵 Tell your friends, Colleagues and family to follow, like, and share. Boost the strength of our robbery team. Every day in this market make money with ease by using the Thief Trading Style.🏆💪🤝❤️🎉🚀
I'll see you soon with another heist plan, so stay tuned 🫂

$7.675 might be a next targetOn this chart we can see that the liquidity at the previous weekly low has been drawn so I think that the price could go to the previous weekly high.

Polkadot/USD short trade 4HThe market sentiment has changed to bullish for a small period of time.
So that means I'm looking for sell opportunity's because the price will fall down after a small bullrun like this.
Polkadot is one of the candidates that is reaching a nice supply zone.
So the trade idea is simple I place a limit buy order at the indicated area, and if price is exhausted enough if will fall down very quick.

DOTUSD TRADE IDEAon 1 hour timeframe , i have mapped out the BOS and point of interest. trying to trade with the 1 hour market trend. Long soon..

Dot Value Buy
A spot purchase for DOT holds value for long-term holders here. The 89 SMA (Blue) and 377 SMA (Red) converge soon, while the 34 SMA is the Black MA). The price may go lower, but I see value here for long-term holders. It is hard to predict what the market will do.
