DOT/USD - Potential 85% SetupHello Traders!
The DOT began to accumulate in the $15.90 - $23.00 range after the end of the correction
The price has consolidated above MA100 on the daily timeframe and is testing the upper boundary of the accumulation range, the level of $23.00
Entry into short-term purchases can be looked for in the range of $20.75 - $23.00
Consider exiting by stop-loss in case the price goes below $17.00
The targets will be price levels of
$30,00
$34,40
$39,00
Good luck and watch out for the market
P.S. This is an educational analysis that shall not be considered financial advice
DOTUSD trade ideas

DOT is ready to reverseDOT has cleared the trendline and is forming IHS pattern and should run to test $21-$23
Once the neckline is clear at $23 that should push to complete IHS up to $32 range.
Good Luck

DOTUSD D1: 500%+ gains THE BEST Level to BUY/HOLD (SL/TP)(UPDATEWhy get subbed to me on Tradingview?
-TOP author on TradingView
-2000+ ideas published
-15+ years experience in markets
-Professional chart break downs
-Supply/Demand Zones
-TD9 counts / combo review
-Key S/R levels
-No junk on my charts
-Frequent updates
-Covering FX/crypto/US stocks
-before/after analysis
-24/7 uptime so constant updates
🎁Please hit the like button and
🎁Leave a comment to support our team!
DOTUSD D1: 500%+ gains THE BEST Level to BUY/HOLD (SL/TP)(UPDATE)
IMPORTANT NOTE: speculative setup. do your own
due dill. use STOP LOSS. don't overleverage.
IMPORTANT NOTE: read entire idea before
execution. Tagged as BULLISH because I expect
reversal after pullback.
🔸 Summary and potential trade setup
::: DOTUSD D1 chart review
::: chart looks good /strong
::: HOWEVER short-term
::: expect mild PULLBACK
::: setup still valid as of right now
::: previously massive BULL TRAP after
::: FAILURE to break CYCLE HIGH
::: get ready to BUY LOW later
::: expecting BEAR TRAP near 20USD
::: i.e. FAKE BREAKDOWN of key S/R
::: best reload bulls near 20USD later
::: expecting 500% bull run
::: re-test of sliding S/R line
::: near 100 USD later
::: BULLS stay out be ready later
::: expecting short-term correction
::: BULLS get ready to BUY after CORRECTION
::: TP bulls is +1000% gains later
::: expecting decent gains soon
::: 20-25% PULLBACK short-term
::: recommended strategy: BUY/HOLD after CORRECTION
::: TP BULLS +500% gains / 100 USD
::: BEST reload BULLS near 20 USD
::: TP BULLS is 100 USD final EXIT
::: SWING TRADE: BUY/HOLD IT
::: bull run not over yet
::: good luck traders!
::: BUY/HOLD and get paid. period.
🔸 Supply/Demand Zones
::: N/A
::: N/A
🔸 Other noteworthy technicals/fundies
::: TD9 /Combo update: N/A
::: Sentiment mid-term: BULLS
::: Sentiment short-term: BEARS/PULLBACK
RISK DISCLAIMER:
Trading Crypto, Futures , Forex, CFDs and Stocks involves a risk of loss.
Please consider carefully if such trading is appropriate for you.
Past performance is not indicative of future results.
Always limit your leverage and use tight stop loss.

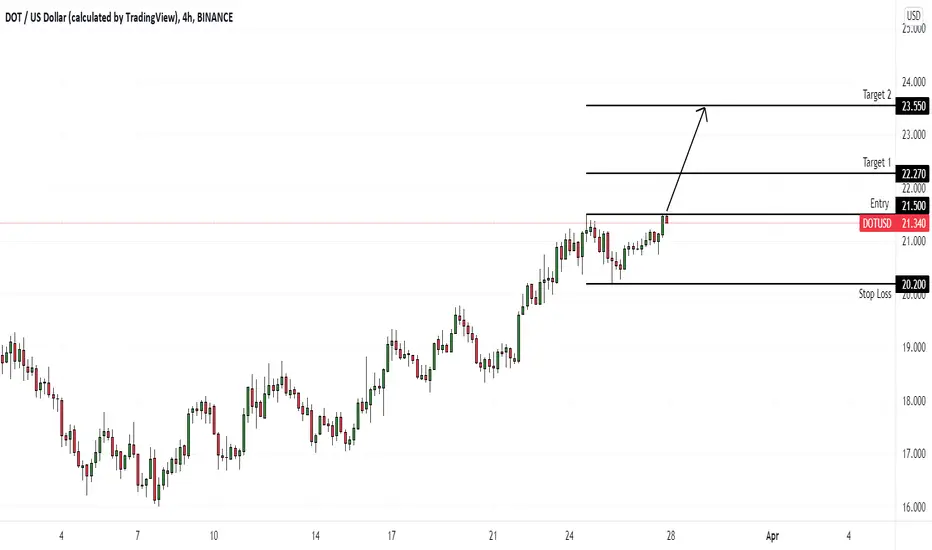
DOTUSD (4H) Bullish breakoutHi Traders
DOTUSD (4H Timeframe)
The market is in an uptrend, and we are waiting for an entry signal to go LONG above the 21.50 resistance level. Only the downward break of 20.20 would cancel the bullish scenario.
Trade details
Entry: 21.50
Stop loss: 20.20
Take profit 1: 22.27
Take profit 2: 23.55
Score: 5
Strategy: Bullish breakout
PolkaDot 2022/2023 road to $200I don't think I need to explain Dot as everyone is familiar with this project. Let's get into the targets, shall we?
T1: $79
T2: $120
T3: $200

DOTUSD has be consolidating since january2021This is among the top web3 crypto projects to watch over so carefully this year.falling wedge has be broken

Dot/UsdHello traders! For my opinion this crypto is buy.
Don`t forget to look the economic calendar!
MAKE MONEY AND ENJOY LIFE 💰
THANK YOU!
GOOD LUCK!
🙏🏻🙏🏻🙏🏻

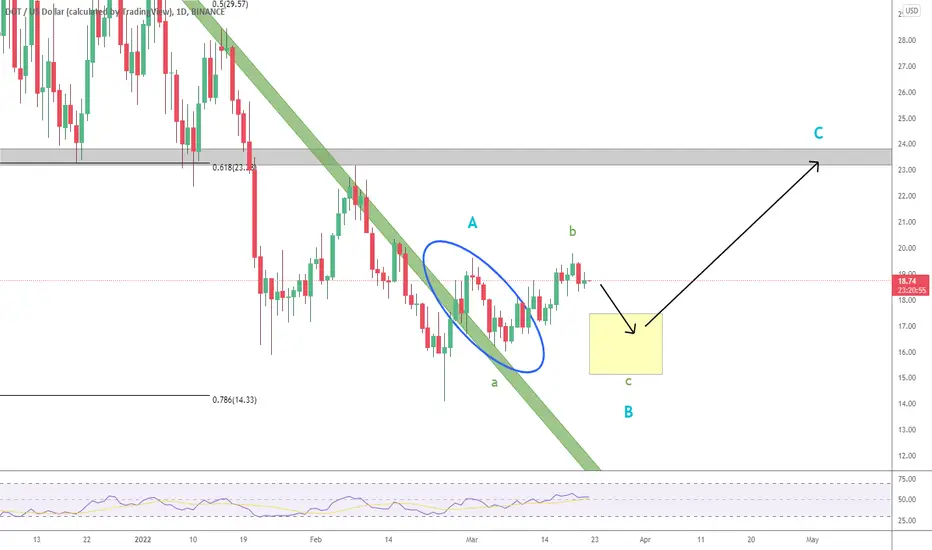
DOT downwards channel breakoutDOT has completed a 5 wave correction sequence in a downward channel from its highs into a weekly demand zone. Its had a high volume bottom as it come into the zone and closed with a rejection wick and pinball close on weekly. The trend has started to reverse and put in a HH on the 3D having reset on the RSI from being oversold and now trading above the MA and looking like it could be the beginning of a new uptrend. Swing structure on weekly looks good, HH and HL formation so id expect the high to get taken and DOT to put in a new ATH from here based upon HTF analysis. MACD also converging showing momentum coming into the market on buyer side coinciding with new wave the the upside.

The Reversal has Begun DOTUSDSimilar situations can be seen between the previous reversal and the one we are about to see
entering into DOT right now is nice because it is already in a state of reversal
Trying out new indicators

DOT/USDHello everyone, if you like the idea, do not forget to support with a like and follow.
DOT BEARISH PATTERN.
REMINDER: THIS IS NOT FINANCIAL ADVICE.


$DOT starting to outperform $ATOMDOTUSD appears to beginning some outperformance compared to one of its peers, ATOMUSD. They are both interoperability tokens that have similar goals and functions. I would personally put them in the same group, but correct me if I'm off base.
On a 6 month basis, ATOM has outperformed DOT by a significant amount over the past 6 months depending on your point of reference.
ATOM has a market cap of roughly $8 billion. DOT has a market cap of roughly $29.5 billion.
If this recent outperformance by DOT continues, it could began to catch up to its peer, which has really been putting the petal to the metal over the last six months. Could be DOTUSD's turn for some sustained outperformance.
Long-term view of ATOM's outperformance over the last 6 months.

DOT has massive upside from current levelBINANCE:DOTUSD
after hitting a 88% retrace DOTUSD looks to have bottomed and looking to run
will we see a macro turn around to help push these levels higher?

DOT LongPolkadot token (DOT) found support on higher time frame and price made a higher high formation, which was the first bullish sign after long period of price decrease from December ATH. DOT is now moving bullish from the break out of descending triangle pattern. The same pattern was established in July last year, when DOT bottomed out at around $10. RSI is nicely picking up and is in bullish zone on daily chart, price is above 13- and 20- moving average, indicating, bulls are in control.

Dot price movement predictions NGU NFAi see either a lower low fake out, back to range, then pump in the 'orange'.
Rise from here in the 'green', or bull-trap the breakout traders & stop em out with an insta-low in the 'yellow'.
As long as btc keeping this pa, I see no reason why any of these 3 can't play out. NGU NFA

DOT - Attempting some sort of recoveryDOT broke down from the MAJOR 23-24 support, which then served as resistance.
Next major support is at 10-11, but we at least broke out from and retested the green falling trendline (blue circle). We could see a recovery to retest the 23-24 resistance.
My trading plan is to wait for one more down leg, then look for longs up to resistance.
BULLISH TREND IN DOT/USDT There is a bullish tendency for DOT/USDT from 3,4 days. Long would be beneficial here

DOT - Parallel Channel testWe will see how this plays out. What we're really looking for is another crypto bull run this year.
Take care.

DOT Exchange Trading Idea 22-03-20DOT is STILL hovering around 83.5% for the past two weeks or more. Really almost a month since it first came down here. As with all cryptos, there is no technical reason to expect price to move up. It even bounced off the 50 EMA this week.

DOT: long opportunity Hello Colleagues, it seems that DOT has broken the descending triangle. it is good to hold some especially between 17-19$. DOT has been undervalued for the last months, and this breakout may reverse the trend especially if it will be confirmed again by a new higher high.
My stop loss will be a daily close under 15$ which may lead to more drop.
@ Kurd_Crypt

DOTUSD D1: 1000%+ gains THE BEST Level to BUY/HOLD (SL/TP)(UPDATWhy get subbed to me on Tradingview?
-TOP author on TradingView
-2000+ ideas published
-15+ years experience in markets
-Professional chart break downs
-Supply/Demand Zones
-TD9 counts / combo review
-Key S/R levels
-No junk on my charts
-Frequent updates
-Covering FX/crypto/US stocks
-before/after analysis
-24/7 uptime so constant updates
🎁Please hit the like button and
🎁Leave a comment to support our team!
DOTUSD D1: 1000%+ gains THE BEST Level to BUY/HOLD (SL/TP)(UPDATE)
IMPORTANT NOTE: speculative setup. do your own
due dill. use STOP LOSS. don't overleverage.
IMPORTANT NOTE: read entire idea before
execution. Tagged as BULLISH because I expect
reversal once we hit 8/9 USD.
🔸 Summary and potential trade setup
::: DOTUSD D1 chart review
::: chart looks good /strong
::: HOWEVER short-term
::: expect 40-50% correction mode
::: setup still valid as of right now
::: previously massive BULL TRAP after
::: FAILURE to break CYCLE HIGH
::: get ready to BUY LOW later
::: expecting BEAR TRAP near 8/9USD
::: i.e. FAKE BREAKDOWN of key S/R
::: best reload bulls near 8/9USD later
::: expecting 1000% bull run
::: re-test of sliding S/R line
::: near 100 USD later
::: BULLS stay out be ready later
::: expecting short-term correction
::: BULLS get ready to BUY after CORRECTION
::: TP bulls is +1000% gains later
::: expecting decent gains soon
::: 40-55% CORRECTION short-term
::: recommended strategy: BUY/HOLD after CORRECTION
::: TP BULLS +1000% gains / 25 USD
::: BEST reload BULLS near 8-9 USD
::: TP BULLS is 100 USD final EXIT
::: SWING TRADE: BUY/HOLD IT
::: bull run not over yet
::: good luck traders!
::: BUY/HOLD and get paid. period.
🔸 Supply/Demand Zones
::: N/A
::: N/A
🔸 Other noteworthy technicals/fundies
::: TD9 /Combo update: N/A
::: Sentiment mid-term: BULLS
::: Sentiment short-term: BEARS/PULLBACK
RISK DISCLAIMER:
Trading Crypto, Futures , Forex, CFDs and Stocks involves a risk of loss.
Please consider carefully if such trading is appropriate for you.
Past performance is not indicative of future results.
Always limit your leverage and use tight stop loss.

Game plan for DOT _ Update _ Turning Point !POLKADOT is at a turning point.
Not the financial board.
Just for fun.
If there are many short positions open, it can be squeezed liquidation of traders and then continue down. (less likely).

DOT Exchange Trading Idea 22-03-13DOT is hovering around 83.5% for the past two weeks or more. Really almost a month since it first came down here. As with all cryptos, there is no technical reason to expect price to move up.
