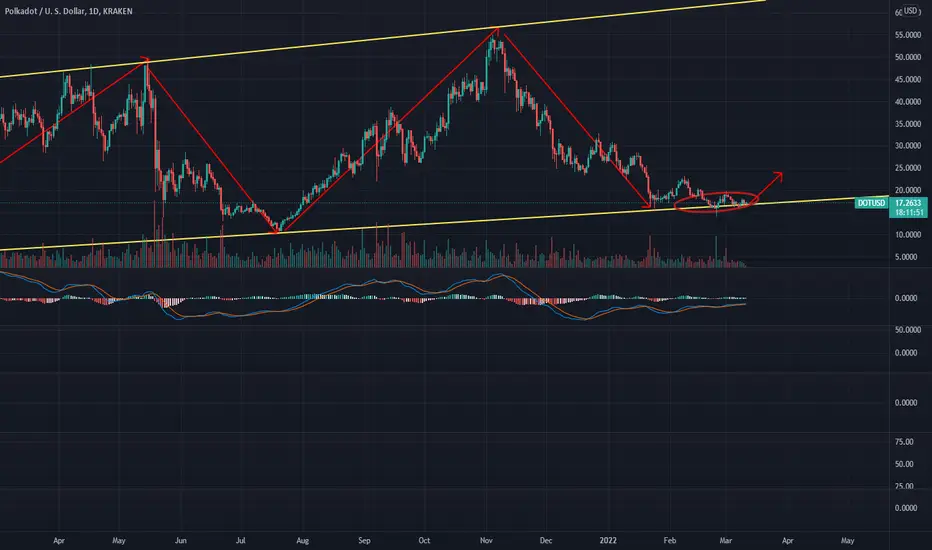
Game plan for DOT _ Update _ Fakeout ?POLKADOT
A possible DOT fakeout can lose 30% if BTC drops.
Not the financial board.
Just for fun.
DOTUSD trade ideas

Polkadot possible buy setupanticipating the next impulsive move.
three scenarios that can play out.
-consolidate and reverse to the upside.
-break the previous low and reverse.
-double bottom and reverse.
Good Luck.

Polkadot DOT with bullish divergence but RSI resistancePolkadot DOT with bullish divergence but RSI resistance
Breaking the RSI resistance would be a first bullish signal.
Flipping MA Ribbon green the next step.
Breaking the huge volume resistance at $34.85 would be "Breaking news" itself.
What do you think?
Drop me a nice comment if you'd like me to analyze any other cryptocurrency.
*not financial advice
do your own research before investing

DOT, consolidating at the support levelThe following is machine translation:
A pullback to a major trendline support level.
Stop falling, shock consolidation.
Gradually oscillated within a narrow range.
Ready to go, the probability of rising is high, look long.
$DOT - buy low, they say... - PoldaDOTI like the accumulation, that is going on here, nice higher lows higher highs in the very long term.
The first big correction turned at the 886. Now once more, price is at the 886 since the low in July 2021 and the ATH.
This could clearly be a spot to accumulate DOT for the long term.
Stay safe!

DOTUSD short entry to 16target profit 1 16
target profit 2 15.8
stop loss just above previous lower high (lh)

Game plan for DOT _ Update _ DOT has returned to the descending channel after the fakeout and is currently right on the edge. If there is a return to the canal, I expect a decline.
If there is no novelty or manipulation on the market that could turn the direction upwards, the game plan is still valid.
Not the financial board.
Just for fun.

Long Idea : DOT/USD Long Idea : DOT/USD
If the research holds true we are anticipating the market to turn bullish once the market breaks into the buy zone and Long term we anticipating the market to push to our target 62.64038683 .
Take Profit (TP)1 : 53.98448969
Take Profit (TP) : 62.64038683 Long term
Stop Loss (SL) : 6.80493256

DOT Exchange Trading Idea 22-03-06Bouncing off the 88.6% level last week. This week we are nearing the 88.6% level again. That really means a cheaper entry for staking. I still like this project long-term.

#DOT #Polkadot #Crypto#DOT is fighting to stay above its upward sloping support line which is in confluence with the orange correction box of the white buy ABC wave wich is building currently.

possible bullish pattern for dotdot is in a falling wedge, chance are we break to the upside in the coming week/weeks. but not guaranteed but a possible scenario. or a fake out to the downside (bear trap) before we go up.

Game plan for DOT _ Update _ DOT is back in the downlink channel, if it does not return up there will be a drop.
Not the financial board.
Just for fun.

Are altcoins showing meaningful trends?KRAKEN:DOTUSD
This thought comes from the "Bitcoin Rainbow" www.blockchaincenter.net
Specifically here I think there's starting to be hints of what a hardcore HODL'r might define as a buying channel.

Polkadot (DOT) - March 3Hello?
Traders, welcome.
If you "follow", you can always get new information quickly.
Please also click "Like".
Have a good day.
-------------------------------------
(DOTUSD 1W Chart)
If support is found above the 16.15 point, I would expect it to move above the 20.27 point.
However, to turn into an uptrend, it must rise at least 23.0 points.
If it falls below the 16.15 point, it is expected that the price will fall near the 10.16 point, so you need to trade cautiously.
(1D chart)
The 20.22-23.31 interval is an important interval that determines the trend.
Therefore, it is important to rise to the 20.22-23.31 section and find support.
The next volatility period is around March 12.
-------------------------------------
(DOTBTC 1W chart)
0.0003 911 - 0.0004 872 section: volume profile section
If it falls below the 0.0003 911 point, it may move up near the 0.0003 242 point, so trade with caution.
It needs to rise above the 0.0005 287 point to turn into an uptrend.
However, it is expected that the uptrend will continue only when it deviates from the downtrend line.
------------------------------------------
We recommend that you trade with your average unit price.
This is because, if the price is below your average unit price, whether the price trend is in an upward trend or a downward trend, there is a high possibility that you will not be able to get a big profit due to the psychological burden.
The center of all trading starts with the average unit price at which you start trading.
If you ignore this, you may be trading in the wrong direction.
Therefore, it is important to find a way to lower the average unit price and adjust the proportion of the investment, ultimately allowing the funds corresponding to the profits to be able to regenerate themselves.
------------------------------------------------------------ -----------------------------------------------------
** All indicators are lagging indicators.
Therefore, it is important to be aware that the indicator moves accordingly with the movement of price and volume.
However, for convenience, we are talking in reverse for the interpretation of the indicator.
** The MRHAB-O and MRHAB-B indicators used in the chart are indicators of our channel that have not been released yet.
(Since it was not disclosed, you can use this chart without any restrictions by sharing this chart and copying and pasting the indicators.)
** The wRSI_SR indicator is an indicator created by adding settings and options to the existing Stochastic RSI indicator.
Therefore, the interpretation is the same as the traditional Stochastic RSI indicator. (K, D line -> R, S line)
** The OBV indicator was re-created by applying a formula to the DepthHouse Trading indicator, an indicator disclosed by oh92. (Thanks for this.)
** Support or resistance is based on the closing price of the 1D chart.
** All descriptions are for reference only and do not guarantee a profit or loss in investment.
(Short-term Stop Loss can be said to be a point where profit and loss can be preserved or additional entry can be made through split trading. It is a short-term investment perspective.)
---------------------------------

DOTUSD - Emergency Update to Channel with Battling ArcsThe market just woke up and DOT has definitively broken out of the red arc it had been following down for months.
I redrew the arcs to see what it looks like if we've already seen the local bottom.
If the green arc back up to the channel top plays out, we will see DOT in the $65 range in early summer.
If that is the case, smaller DOT ecosystem tokens like GLMR, PDEX, and ACA should see even bigger gains.
This is in line with what I see as the macro picture unfolding. The world is waking up to the need for crypto.
Enjoy.

DOTUSD D1: 1000%+ gains THE BEST Level to BUY/HOLD (SL/TP)(UPDATWhy get subbed to me on Tradingview?
-TOP author on TradingView
-2000+ ideas published
-15+ years experience in markets
-Professional chart break downs
-Supply/Demand Zones
-TD9 counts / combo review
-Key S/R levels
-No junk on my charts
-Frequent updates
-Covering FX/crypto/US stocks
-before/after analysis
-24/7 uptime so constant updates
🎁Please hit the like button and
🎁Leave a comment to support our team!
DOTUSD D1: 1000%+ gains THE BEST Level to BUY/HOLD (SL/TP)(UPDATE)
IMPORTANT NOTE: speculative setup. do your own
due dill. use STOP LOSS. don't overleverage.
IMPORTANT NOTE: read entire idea before
execution. Tagged as BULLISH because I expect
reversal once we hit 8/9 USD.
🔸 Summary and potential trade setup
::: DOTUSD D1 chart review
::: chart looks good /strong
::: HOWEVER short-term
::: expect 40-50% correction mode
::: setup still valid as of right now
::: previously massive BULL TRAP after
::: FAILURE to break CYCLE HIGH
::: get ready to BUY LOW later
::: expecting BEAR TRAP near 8/9USD
::: i.e. FAKE BREAKDOWN of key S/R
::: best reload bulls near 8/9USD later
::: expecting 1000% bull run
::: re-test of sliding S/R line
::: near 100 USD later
::: BULLS stay out be ready later
::: expecting short-term correction
::: BULLS get ready to BUY after CORRECTION
::: TP bulls is +1000% gains later
::: expecting decent gains soon
::: 40-55% CORRECTION short-term
::: recommended strategy: BUY/HOLD after CORRECTION
::: TP BULLS +1000% gains / 25 USD
::: BEST reload BULLS near 8-9 USD
::: TP BULLS is 100 USD final EXIT
::: SWING TRADE: BUY/HOLD IT
::: bull run not over yet
::: good luck traders!
::: BUY/HOLD and get paid. period.
🔸 Supply/Demand Zones
::: N/A
::: N/A
🔸 Other noteworthy technicals/fundies
::: TD9 /Combo update: N/A
::: Sentiment mid-term: BULLS
::: Sentiment short-term: BEARS/PULLBACK
RISK DISCLAIMER:
Trading Crypto, Futures , Forex, CFDs and Stocks involves a risk of loss.
Please consider carefully if such trading is appropriate for you.
Past performance is not indicative of future results.
Always limit your leverage and use tight stop loss.

DOT Exchange Trading Idea 22-02-27Bouncing off the 88.6% level this week. I really hope we can tame the crypto markets but Russia needs to get out of Ukraine for that to happen. I still love this project for it's staking rewards.

POLKADOT SWING TRADESeems like we have a Great risk and reward option and opportunity. Not sure if this is the dip of the market however it is a great R/R ratio.
Polakadot has amazing opportunity with Tokenization coming around the corner their technology put them in a good position.
If YOU NOT a hater and support others like this post! It does MAKES A DIFFERENCE
This one Falls In our research on swing set ups with a good ratio of Risk and Reward.
As always we put quality over quantity, don’t forget to follow us for SWING trades research on risk and Reward Ratio.
Subscribe and don’t miss OUT the next research.
Swing trading is great because you can create a lot wealth in % by risking less $$. Compound Gains.
Thank you for the Love, I really appreciate those likes, makes a difference and pushes me to keep on posting more of these!

DOTUSD - Update to Long-Term Channel with Battling ArcsJust keeping my eye on this one.
DOT is almost at the bottom of the channel here. I'm looking for support at $12.66.
These are uncertain times, and it's hard to see how things are going to turn out in 2022. Best to wait to see whether the green arc confirms, or the red arc extends below the channel before making a move.


Future of DOTStarting to get near decision time for DOT and have both situations covered to the best of my ability

DOTUSD -> Long @ 11-9 zone.. TARGET 23 and More...DOTUSD is a clear TECHNICAL BUY with a short term term Target of 100%..

DOT...Another braindead easy long - accumulate here and do nothing for a while and win...so simple 99% of people won't do it.
