DOT Now What?For DOT to regain entry into the Pitchfork, there should be some resistance at the lower level.
Shows potential double bottom support fib around $38
RSI may encounter resistance before breakout.
MACD and Squeeze may slowly build momentum to move up?
Appears consolidation may occur between $38 and the YELLOW descending trend line until a breakout occurs.
Until BTC decides where crypto is going in the short term DOT will range.
Good Luck
DOTUSD trade ideas

DOT uPDOT has been nicely accumulating the red area... a nice breakout out of the box will definitely make a floor of this area.
I'm expecting the first upside to be around 15%+ to the nearest resistance area. I would bet on starting to accumulate here, as we may have more gains in near future.

It's time to load up on Polkadot!Hello everyone! It's been a while since a major correction on $DOT. What a bull run, huh? $DOT was up as much as 410% since it's lows in mid-July. So should you go ahead and get some now that it is down 20% from its initial highs, or should you shave off these gains? I'm here to help you out.
Technical analysis
$DOT has formed a beautiful uptrend which continues to show signs of strength. Given the fact that crypto went mainstream, I think that such a promising coin with a lot of innovation has quite a chance of reaching new all-time highs. ( Currently, Polkadot is 8th biggest cryptocurrency in the world by market cap )
Innovation behind Polkadot
Relay Chain: The base Polkadot chain is the relay chain that connects all these individual chains. As such, they can organically solve interoperability issues between these connecting chains.
Parachain: This stands for parallelized chains that run through the Polkadot network. These help scale up the system by parallelizing operations.
Bridge Chain: This chain connects different blockchains that don’t use Polkadot’s governance protocols.
Trading plan
The general idea behind an uptrend is to buy at the support zone and sell at the resistance zone. And that's what I want you to do. I think it's a great time to enter a long position. In case of a breakout to the downside, use a stop loss. I would recommend setting it 3-5% bellow your entry price. Hope this helps. Feel free to leave a comment down below. See you soon, in the next one!

dot long swing ~similar scenario as my last 2 posts, dot has a daily algorithmic buy signal starting to flash, will confirm at todays close.
i believe dot is in a deep sub-wave 4 here, and it's got one last leg to go, similar to btc.
my upside target for this sub-wave 5 = $64
it could break before then, so take profit along the way as needed.
keep an eye out for updates just in case something ends up changing.

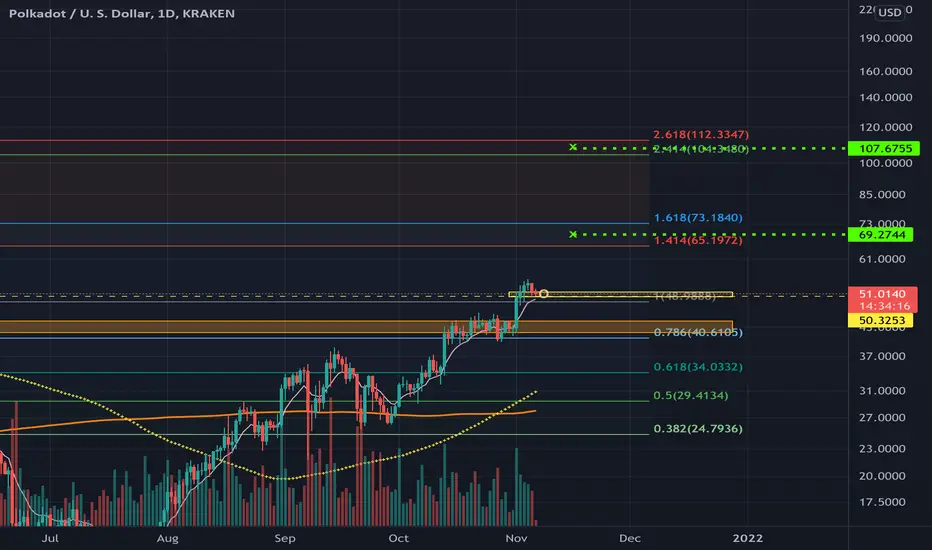
DOTUSD - Update to Long-Term Channel with Battling ArcsIn my last analysis, I said that if DOT breaks back into the smaller bearish arc after breaking out and then retesting, it would invalidate my target of $95-120 by year's end.
That invalidation happened in the last dip, and today we see a possible second break to the upside of the smaller bearish arc, putting the original bullish scenario back into play.
I extended the parabolic arc out a bit, and both scenarios are still in play. I would look for $50+ as a confirmation of the upside target, and a failure to regain $50 in November as a confirmation to the downside.
My bias is still bullish on the crypto market and DOT in particular. I'm looking for a break of $50 by the end of the month and a fast move upwards towards $95+ thereafter.
Good luck and enjoy.

DOT UPDATE!Like i posted earlier on DOT getting closer to my take profit target $44... funny enough i missed the trade

DOTUSD (4H) Bullish reversalHi Traders
DOTUSD (4H Timeframe)
Waiting for the upward break of 43.02 resistance level, which will complete a bullish trend reversal pattern to go LONG. Only the downward break of 37.32 would cancel the bullish scenario.
Trade details
Entry: 43.02
Stop loss: 37.32
Take profit 1: 46.37
Take profit 2: 52.07
Score: 5
Strategy: Bullish reversal

Polkadot Schemei never been a moon boy but i like to predict hope.
Everything is always depending on theKing but if we get a new bullish impulse before next year, DOT could follow his master this way.
Remember to manage your invests, Don't go all in, follow BTC movements, keep money to rebuy in case of fail.
The Key is yourself.
This chart is still conservative in the numbers to reach.
--------------------------------------------------------------
Trading Parts
--------------------------------------------------------------
TP1 = 75$ ish
TP2 = 100$ ish
--------------------------------------------------------------
Happy Trading

DOTUSD LONG?Watching Polkadot Weekly chart. Price is testing 40USD level. The price is also ascending on the upper trend line which is also confirmed on the daily candle chart. Waiting for weekly close for the main body of the candle to close above 40USD for a confirmation of a long.

New idea on BTCAll bitcoin move bit scenarios are shown in this chart.
The video also talks about price-prone tokens.

Educational. How to trade a broadening wedge pattern? In this video:
* How to spot and draw a broadening wedge pattern.
* What constitutes an official broadening wedge pattern.
* Is the pattern bullish or bearish?
* What is the probability of breaking down vs. moving further up?
* How to measure target down and how to measure target up?
* Other notes to make on how to trade.


UPDATE ON DOTMy DOT long position is going well... who wants to take the trade can take it once it breaks out from the trendline, it seems like a bull flag dont really know but i am 90% sure it would breakout and pump today. i want to know your thoughts guys???

DOT Daily Stochs Ready For Lift OffWe see multiple factors coming together for DOT after the sell off market wide.
Stochastic RSI has found its bottom here on the Daily chart and now pointing up, with RSI pointing up in agreement.
The price action and underlying momentum wave are primed to flip approximately $42 price to very strong support.
Parachain auctions and WEB3 are just around the corner, just look at EGLD as well.
Entries at this point may see good gains in short and long term!
O7

DOTUSD - LONG After BTC correction, DOTUSD is in a perfect entry point for a long position after boucing back from 0.38 Fibonacci level, 50-day SMMA and support line.

MY DOT LONG POSITION DOT about to breakout... once it breaks out from the trend line i will be longing DOT, Tp target is $44.3 while SL is $39.4
Lets go.

DOTUSD - possible shortHello all,
DOTUSD has recently broken out of the midterm rising wedge pattern.
Now it seems like it is going to form an AAD pattern on 1H-4H time frame.
Possible points for successful entry, scale-in, SL and TP are pointed on
the graph. Good luck!
Disclaimer: Any risk related to trading this cryptocurrency is solely on you. Please, think thoroughly before making any trading decision.

Polkadot Crypto OutlookPotential formation of a Bullish Butterfly pattern could signal a retracement to set up for the next expansion to ATH.

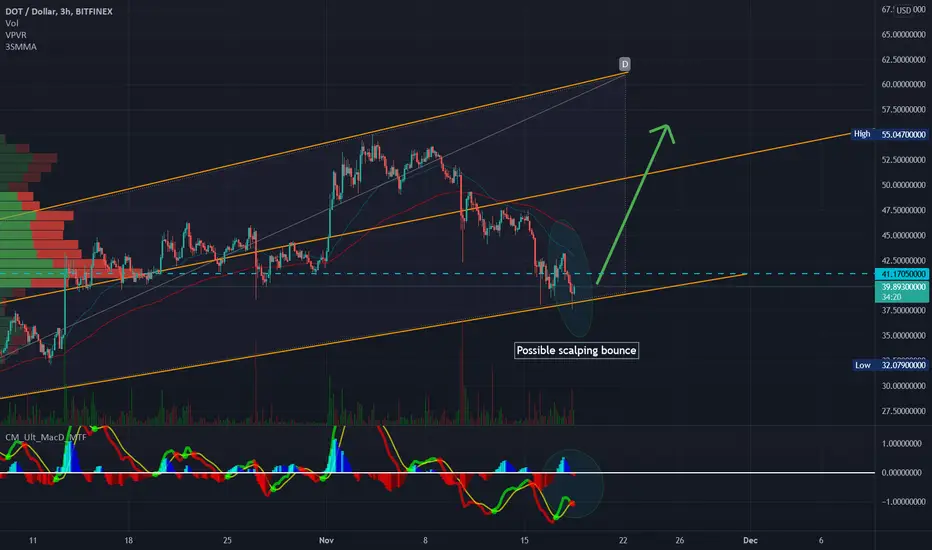
DOT Polkadot could be in a great position for a supbounce scalp For you scalpers out there DOT is at the support area of a long broadening wedge. I really wanna wait for candle confirmation to make the actual trade myself but it looks do-able. SL @ 37.33. The biggest issue right now with all of this is Bitcoin. BTC controls how the rest of the market acts. Right now BTC is falling day by day after getting to ATHs last week. So it needs to be monitored with your trade. When scalping you NEED to always watch Bitcoin and use BTCs momentum in conjunction with your scalp trade. DOT still has an excellent outlook and hopefully we see a bounce here and a rise back up to resistance.

Polkadot Bullish Trend: LongPolkadot has established a clear channel and is currently testing support.
Expect reversal with DOT to begin bullish action and enter price discovery as the auctions gain momentum and the Polkadot ecosystem begins to expand.
Reference is the Polkadot test network, Kusama ($KSM) to see impact of auctions on price and mCap.
Fundamental: Parachain Auction Underway
- Phase 1: Auctions #1 thru #5
** Begin: November 11, 2020
** End: December 16, 2021
- Phase 2:
**Begin: December 23, 2021
**End: March 10, 2022

Potential wick off schematic roadmap With an asset depreciating in price and parachain auctions acting as tokenomic deflationary policy, leaves us a good opportunity to buy when price creates new lows.
