DOT recovers at $41 following a steep plungePolkadot price analysis is bullish today.
Resistance for DOT is found at $42
Support for DOT/USD is found at $36.
The DOT/USD price shows recovery after going through a massive loss yesterday, as per Polkadot price analysis. The price stooped as low as $40 from $45 in a market flash crash. The market crash was unexpected as speculations were for DOT to break above $46; however, DOT/USD survived the pullback victoriously as it managed to float above the $40 psychological mark.
DOTUSD trade ideas

DOT - UPDATE! LOOKING FOR A BOUNCE!AS IS THE REST OF THE MARKET! WE'RE LOOKING FOR A BOUNCE! This will depend on the BTC idea I posted (see link below)
A couple spots to watch are identified in the chart. We're in a very volatile area of the markets right now BUT I think we ARE NEAR the bottom of that!
CAUTION TRADERS AND LEVERAGE USERS!
IF YOU HODLING - NO WORRIES! THE MARKET SENTIMENT IS STILL BULLISH AND THIS PULLBACK IS NORMAL
*This is NOT financial advice. This is just an IDEA based off my experience analyzing charts and studying crypto. I recommend researching cryptocurrency because of the potential for you to become A BELIEVER of this technology and its future (FUNDAMENTALS ARE WHAT MAKE OR BREAK CRYPTO) IF YOU HAVE THIS, INVESTING BECOMES MUCH EASIER!*

DOT Inverse H&S while gearing up for a breakoutWatch for the right shoulder to form and complete a breakout of the descending trendline. See where the 1H candle closes and for confirmation
If DOT clears, $46+ should hit and perhaps expose $50.

DOT - Scheduling Lift Off Sometime This WeekIF... Bitcoin can hold here (above $62-63k) or go up , I do believe that we will see PolkaDot have a great increase in value. Specifically here, I am looking at small bullflag, with pole extrapolation to roughly $54-56, and to be honest it could come sooner than later but hard to say. NFA, DYOR

Bullish momentum faces break down at $43.6 levelThe price is going down once again as the latest Polkadot price analysis is confirming the bearish comeback. The price has undergone a decline during the last 24-hours, as the bears interrupted the bullish current by bringing the price down. The price is now following bearish movement momentarily and has moved down to the $43.64 level in the last 24-hours. The bearish momentum has been trending in the last four hours as well.

Polkadot gathering power to break its all time highPolkadot gathering all power to break its all time high.
Current target:- AUD 80
Support:- Mid label of Bollinger band
Disclaimer:- Please do not invest or trade with my ideas. This is only for educational purposes. Please do your own research before investing.
Happy trading.

DOTUSD long-term channel and arcs within channel >$100 incomingThe bearish arc was broken by the power of the bigger bullish arc. Time to ride the wave up to the top of the channel.

short from here.Short it if this structure is broken. Please always like this TA if it's useful and helpful to you. You can put a PO

DOTPERPDOTPERP. Second long into DOT, price formed a bullish flag, how can it not print money? Position closed 5x leverage. Initial position still open.

DOT/USD CAN TOUCH 50$ ???dot/usd is currently trading with very good volume & in channel pattern so wait for to tuch bottom of channelle and ttrade long around 40$ to 39$ for the target of 50$++ BITFINEX:DOTUSD

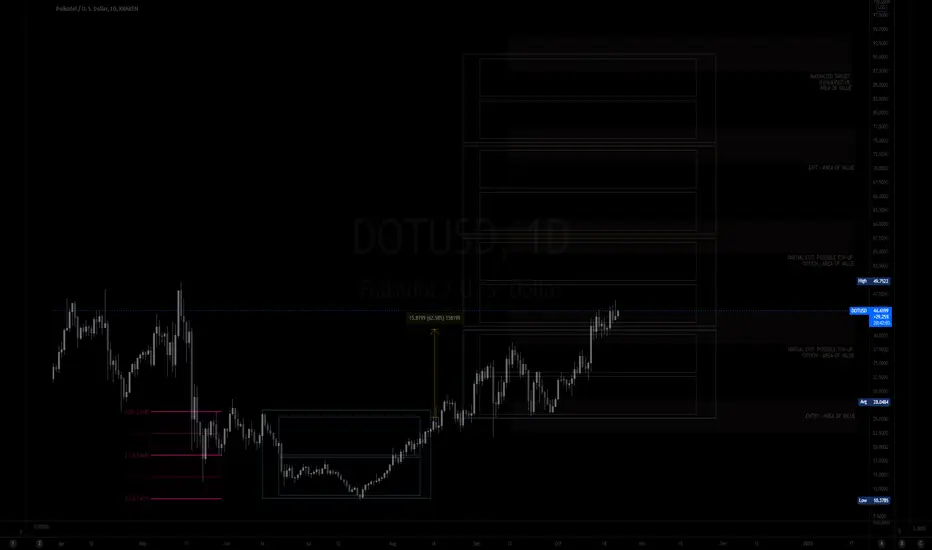
MY MINIMALIST ANALYSIS FOR POLKADOT$DOT
10.23.21
116H +8 SINGAPORE
ALERT: MARKED ENTRIES and EXITS FOR A SWING TRADE
HOW TO USE MY CHART
It is designed for SWING TRADES at the BOTTOM. I do not SHORT (in support of all the DUMB-MONEY traders like me.) Though you can still use it.
Created on a WEEKLY & DAILY Analysis of Dynamics of the Market.
LARGE BOXES are major pivots that will occur, while the small boxes are MINOR PIVOTS. These can be entries to a BUY/ SELL POSITION or an EXIT/PARTIAL EXIT/TOP-UP AREAS.
Watch out for Chart Patterns, Candlestick Math, Market Dynamics, and your Fibs.
This CHART is best used without indicators. The MINOR and MAJOR BOXES (TOPs and BOTTOMs), together with
the market's price action and the above mentioned is sufficient enough as analysis when ENTERING AND EXITING TRADES.
Thank You for your appreciation and support (Follows, Comments, and Likes.)
DISCLAIMER:
The findings of the following analysis are the sole opinions of the publisher of this idea and should not be taken as investment advice.
45. again... 50. & accumulation characteristic
A break upside 44. Is needed to confirm we are keeping on going up.
For now it is looking as an slow forming accumulation cycle, but the cycle has to unfold more to give us that confirmation.
A break under 39. Would make me wait for a test at lower zone for a better buy entries on light supply. Which I would consider 35.5 as next area to look at.
4hours
Daily
Weekly

DOT breakout to $50DOT cleared the descending ATH trend line.
watch for approaching levels to TP on way to $50
Good Luck

Inverted s-h-s for DOT $63 soon!We can see an inverted s-h-s formation inside the channel. DOT just crossed to the next level of the channel.
By knowing parachains are now happening, we can be quite sure that DOt will be one of the biggest gainers during this Q4 and Q1 2022.
I expect the price action to go up to $63 by November.
Appreciate the hard work by clicking like
Happy trading,
Raf

DOT- Added swing tradeHi,
As most of you will already know my strategy, I won't go into much detail. But put simply...I sell 33% at every major resistance and buy the 33% on support of the next major pullback. This has helped me accumulate a LOT more than I would have if I just held.
Today I have added a swing trade from $45 with the target of $50. The price looks to close higher than any other local high and the momentum should quickly push this up to Target.
Good luck if you join


DOT Short againSome pullback needed before it continues the uptrend.
How deep it is depends on the profit taking happening with ETH and BTC.
The whales are in control as usual.

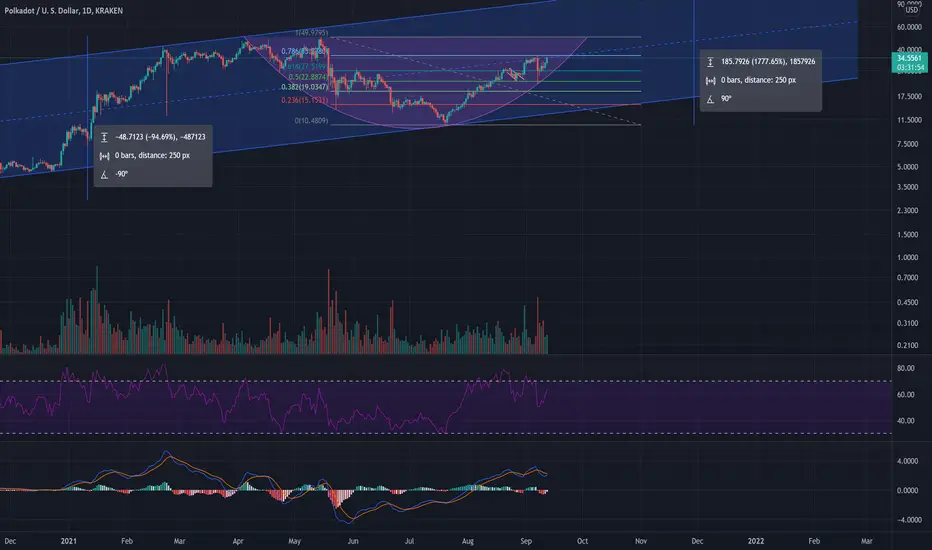
Polkadot Price AnalysisDOT is trading within a tight range after bouncing off the psychological level of 40 earlier in the week. On Wednesday, the altcoin has been on a rebound for two consecutive sessions. Subsequently, it hit an intraday high of 45.53 on Thursday before pulling back. On a three-hour chart, it is trading above the 25 and 50-day exponential moving averages.
In the immediate term, I expect the crypto to trade within the horizontal channel of between Thursday’s high of 45.53 and along the 25-day EMA at 42.65. Above the channel’s upper border, the bulls will strive to retest the year’s high of 49.75. On the flip side, a move below the lower border will likely have the bears retesting the support zone of 40.00.
Feel free to get in touch for premium trade signals

DOT following the trendDOT got support with the 40$ support area and should now head to 48$ resistance.
Nothing to do at the moment, as the buying opportunity was on support as stated in my previous idea.
Let's wait and see how DOT will react on resistance but for now MACD in Weekly, Daily and H4 are well bullish.

DOT - READY TO BREAKOUT AND TEST/BREAK ATH!ALTS ARE LOOKING GOOD TODAY! BTC looking like its pulling back to turn previous ATH into support!
This is a perfect opportunity for alts to catch up and do their thing here!
DOT - IS LOOKING READY TO BREAK OUT AND POSSIBLY BREAK ATH VERY SOON!
BBWP FLASHED A BUY SIGNAL!
MACD looking EXACTLY how we want to see it before a pump!
This is a low risk situation IMO!
GET READY, ITS LOOKING TO BE A GOOD DAY FOR ALTS!

DOTUSD-H4- Bearish CrabPattern is near completion at 46.70
Im placing a sell limit order there.
The ratios are perfect 0.61 - 1.61
Best regards.

Polkadot Update: 11% away from ATH next Target $73 @ 161.80%Polkadot Update 20/10/21: 11% away from ATH @ $49.45, the next Target $73 @ 161.80% Fibs. Happy Trading
Polkadot Update 19/10/21: Bullish Bias still holds! Please See Previous analysis below. Buy Signal from Script triggered on the 1st August: Fast EMA Crossover Slow SMA .
Confirmed reversal, Polkadot Buy Signal from Script triggered: EMA Crossover SMA just below the 23.60% fibonacci level, 43% gain from here to retest the 200 MA. Use buy zone to map your buys. Swing target from here is 160% gain from $18.92 to $49.75.
Current Price Targets: 20/10/21
127.20% Fibs @ $60.08 (35% Gain from current price level)
161.80% Fibs @ $73.59 (66% Gain from current price level)
261.80% Fubs @ $112.66 (155% Gain from current price level)
Happy Trading :)
See previous analysis below.
Polkadot (Dot) Buy opportunity! Potential 50%+ Gain to set a New ATH of $50 at the 161.8% Fibonacci Level. Dot's price soared to a high of $42 on 20/02/21. Since setting this new ATH , it has lost some momentum, retracing down to a low of $26 on the 23/02/21 after such an impulsive move, but currently it is still trading 45% above this low 4days ago on the 23/02/21.
The fundamental outlook for Dot in the long-term is great and still very much bullish , its total Market Cap is at $33.7 billion and currently ranked 6th biggest digital currency in the world after Bitcoin , Ethereum , Cardano , Binance Coin and Tether. Over the coming month we expect Dot to retest the previous ATH of $50 at the 161.8% Fibonacci extension .
