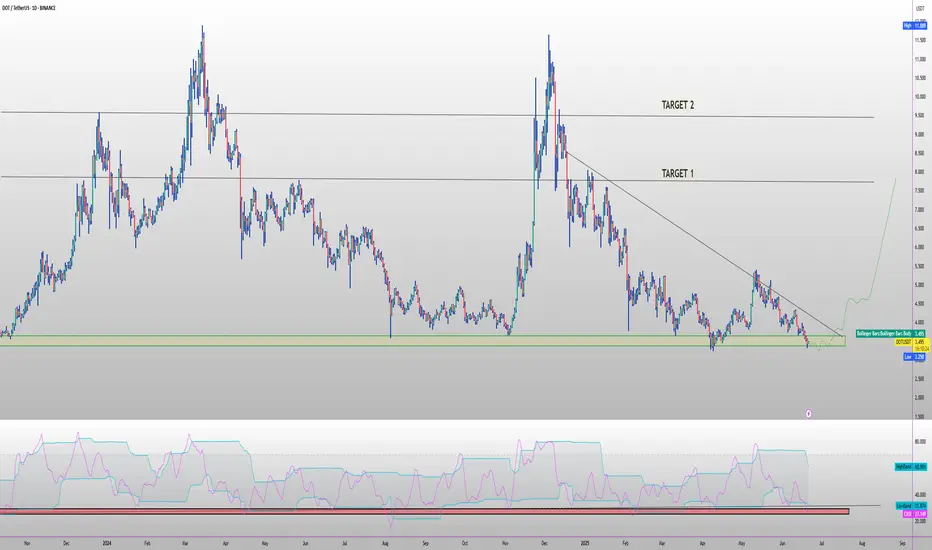
dotusdtdotusdt is testing the trend line . dca time for dot .good area for exposure to dot at this time .spot only dca on every new low weekly

DOT ANALYSIS (3D)Polkadot appears to have reached a fresh and significant support zone, which is potentially where the corrective wave C may come to an end.
If wave C completes here, the price could begin a strong recovery. However, it’s important to note that this is a higher time frame setup, so reaching the targ

Prepare for long DOTUSDTif complex / corrective pattern took place, there is high chance to go long. BINANCE:DOTUSDT

DOT 4H Chart CorrectionI´m treating the recent upside as a corrective movement, and still expect a lower low. Reasons:
-> Upside does not look like a motive wave.
-> Lack of RSI divergence on the 4H or Daily Chart on the recent low.
I will look for reversals in the green resistance levels for short trades.

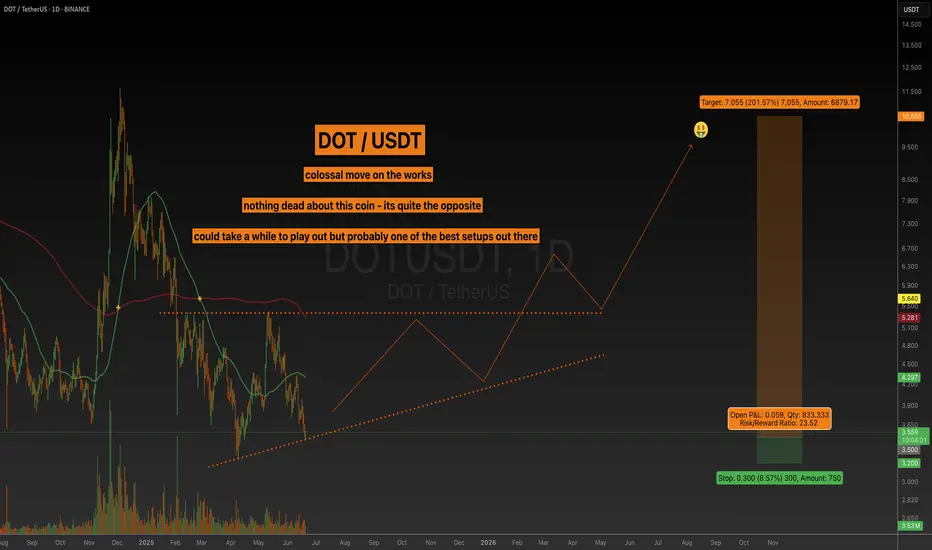
Polkadot (DOT): Should Jump By 120% | Might Jump By 1000%Polkadot has finally reached the 200EMA mark and might be off to a bright start here. The pattern seems to repeat, and we are starting to enter the bull market so eyes wide open now!
More in-depth info is in the video—enjoy!
Swallow Team

Trading plan for DOT this weekTrying a new idea format
BINANCE:DOTUSDT On the chart, we can see a completed ABC upward correction pattern. Currently, we may expect a retest of the local low at $3.27, and after breaking the first support level, we could see a new rally toward the second resistance level at $3.7
Manage your r

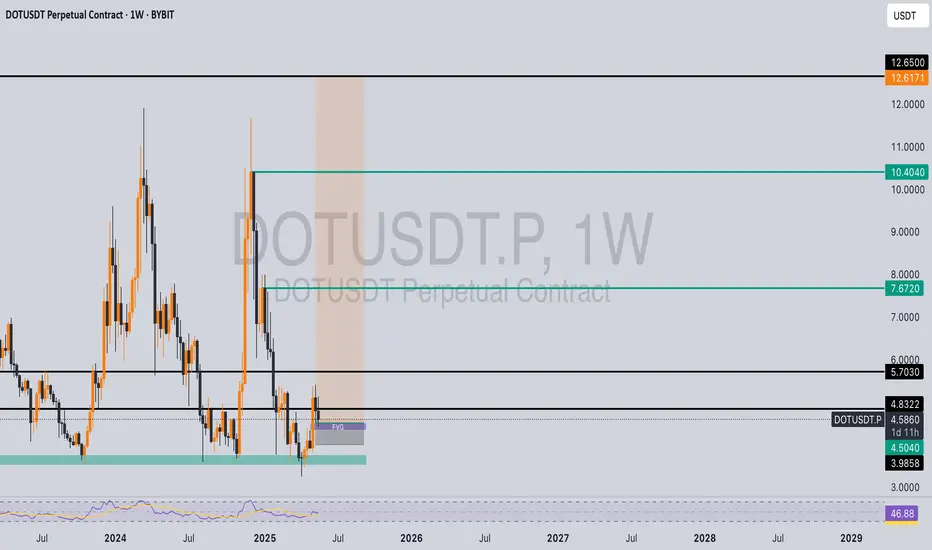
DOT PLAN FOR 2025🔥 MIL:DOT long setup (1D) 🚀
✅ Entry Zone: $3.10 – $3.40 (triple-tested demand)
🎯 Targets
• TP-1: 8.80 (’24 breakdown line)
• TP-2: $10.40 (pre-bear support)
⛔ Stop-Loss
Daily close < $2.5
📊 Thesis
Polkadot 2.0 is rolling out NOW: Agile Coretime marketplace, JAM smart-contract hub & 6-sec bloc
DOTUSDT Long IdeaPolkadot appears poised for a potential move, having taken liquidity and expanded impulsively. The recent fill of the fair value gap (FVG) at the consequent encroachment level, coupled with holding above the order block, suggests a bullish outlook. Continued accumulation at these levels could potent
Polkadot - BEWAREI have been checking out some news and fundamentals lately on this coin.
LMAO makes me laugh people still look into trading memes, investing, whatsoever... Those might get burned once again, cause this BTC.D party aint nowhere to being done. It will continue to remove liquidity from coins with no
DOTUSDT 1W AnalysisDOT ~ 1W Analysis
#DOT Buy back gradually from this support block with a short term target of at least 20%+ from this support.

See all ideas
Summarizing what the indicators are suggesting.
Oscillators
Neutral
SellBuy
Strong sellStrong buy
Strong sellSellNeutralBuyStrong buy
Oscillators
Neutral
SellBuy
Strong sellStrong buy
Strong sellSellNeutralBuyStrong buy
Summary
Neutral
SellBuy
Strong sellStrong buy
Strong sellSellNeutralBuyStrong buy
Summary
Neutral
SellBuy
Strong sellStrong buy
Strong sellSellNeutralBuyStrong buy
Summary
Neutral
SellBuy
Strong sellStrong buy
Strong sellSellNeutralBuyStrong buy
Moving Averages
Neutral
SellBuy
Strong sellStrong buy
Strong sellSellNeutralBuyStrong buy
Moving Averages
Neutral
SellBuy
Strong sellStrong buy
Strong sellSellNeutralBuyStrong buy
Displays a symbol's price movements over previous years to identify recurring trends.