dotusdtdotusdt is testing the trend line . dca time for dot .good area for exposure to dot at this time .spot only dca on every new low weekly
Related pairs

DOT ANALYSIS (3D)Polkadot appears to have reached a fresh and significant support zone, which is potentially where the corrective wave C may come to an end.
If wave C completes here, the price could begin a strong recovery. However, it’s important to note that this is a higher time frame setup, so reaching the targ

Prepare for long DOTUSDTif complex / corrective pattern took place, there is high chance to go long. BINANCE:DOTUSDT

Polkadot - BEWAREI have been checking out some news and fundamentals lately on this coin.
LMAO makes me laugh people still look into trading memes, investing, whatsoever... Those might get burned once again, cause this BTC.D party aint nowhere to being done. It will continue to remove liquidity from coins with no
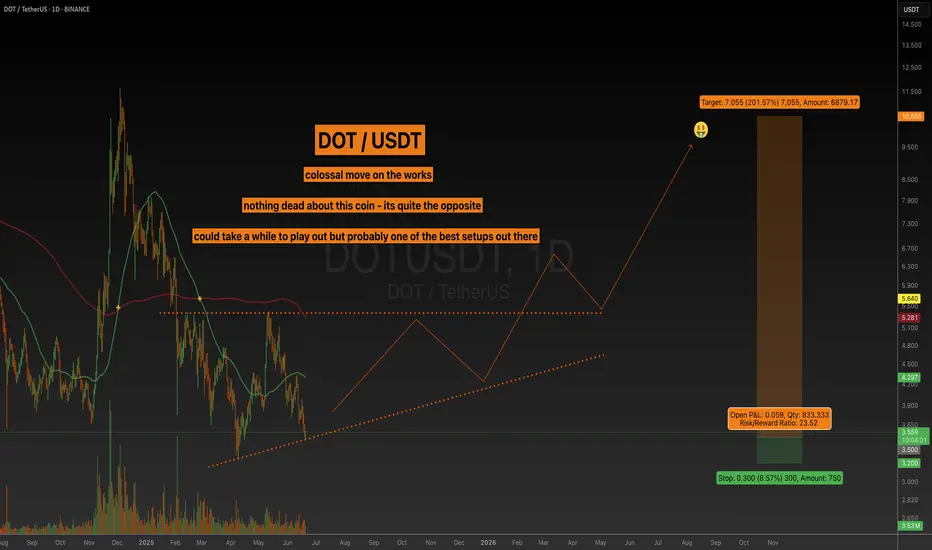
DOT PLAN FOR 2025🔥 MIL:DOT long setup (1D) 🚀
✅ Entry Zone: $3.10 – $3.40 (triple-tested demand)
🎯 Targets
• TP-1: 8.80 (’24 breakdown line)
• TP-2: $10.40 (pre-bear support)
⛔ Stop-Loss
Daily close < $2.5
📊 Thesis
Polkadot 2.0 is rolling out NOW: Agile Coretime marketplace, JAM smart-contract hub & 6-sec bloc
DOTUSDT Long IdeaPolkadot appears poised for a potential move, having taken liquidity and expanded impulsively. The recent fill of the fair value gap (FVG) at the consequent encroachment level, coupled with holding above the order block, suggests a bullish outlook. Continued accumulation at these levels could potent
Polkadot (DOT): Strong Signs of Potential Bullish MovementPolkadot caught our attention with rather good potential for upward movement from here, which can be seen both on 30M timeframe and 4H timeframe
More in-depth info is in the video—enjoy!
Swallow Academy

DOT/USDT - Bullish On the 4-hour chart, DOT/USDT has shown a clear bullish rejection from its significant horizontal support zone around $3.80 - $3.85. This strong bounce indicates robust buying interest at this critical level, signaling a potential reversal and a buying opportunity. The price action here underscores

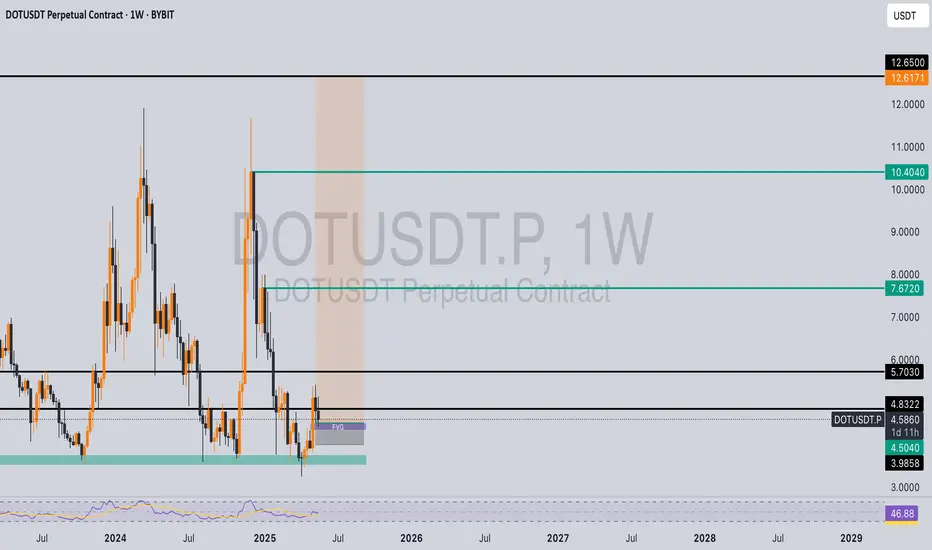
DOTUSDT 1W AnalysisDOT ~ 1W Analysis
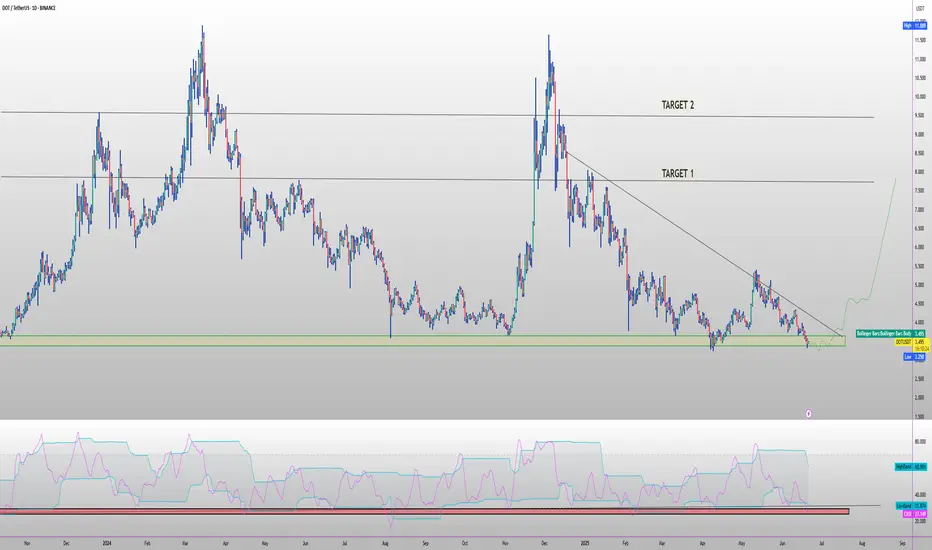
#DOT Buy back gradually from this support block with a short term target of at least 20%+ from this support.

DOT/USDT High win rate scalping signals in 15 minutes (TEST)- Signal: Empty
- Entry: 3.778 ~ 3.782
- Take Profit: 3.761, 3.748

See all ideas
Summarizing what the indicators are suggesting.
Oscillators
Neutral
SellBuy
Strong sellStrong buy
Strong sellSellNeutralBuyStrong buy
Oscillators
Neutral
SellBuy
Strong sellStrong buy
Strong sellSellNeutralBuyStrong buy
Summary
Neutral
SellBuy
Strong sellStrong buy
Strong sellSellNeutralBuyStrong buy
Summary
Neutral
SellBuy
Strong sellStrong buy
Strong sellSellNeutralBuyStrong buy
Summary
Neutral
SellBuy
Strong sellStrong buy
Strong sellSellNeutralBuyStrong buy
Moving Averages
Neutral
SellBuy
Strong sellStrong buy
Strong sellSellNeutralBuyStrong buy
Moving Averages
Neutral
SellBuy
Strong sellStrong buy
Strong sellSellNeutralBuyStrong buy
Displays a symbol's price movements over previous years to identify recurring trends.
Frequently Asked Questions
The current price of POLKADOT/TETHERUS (DOT) is 3.399 USDT — it has risen 0.74% in the past 24 hours. Try placing this info into the context by checking out what coins are also gaining and losing at the moment and seeing DOT price chart.
POLKADOT/TETHERUS price has fallen by −0.32% over the last week, its month performance shows a −24.43% decrease, and as for the last year, POLKADOT/TETHERUS has decreased by −44.75%. See more dynamics on DOT price chart.
Keep track of coins' changes with our Crypto Coins Heatmap.
Keep track of coins' changes with our Crypto Coins Heatmap.
POLKADOT/TETHERUS (DOT) reached its highest price on Dec 4, 2024 — it amounted to 11.641 USDT. Find more insights on the DOT price chart.
See the list of crypto gainers and choose what best fits your strategy.
See the list of crypto gainers and choose what best fits your strategy.
POLKADOT/TETHERUS (DOT) reached the lowest price of 3.016 USDT on Jun 23, 2025. View more POLKADOT/TETHERUS dynamics on the price chart.
See the list of crypto losers to find unexpected opportunities.
See the list of crypto losers to find unexpected opportunities.
The safest choice when buying DOT is to go to a well-known crypto exchange. Some of the popular names are Binance, Coinbase, Kraken. But you'll have to find a reliable broker and create an account first. You can trade DOT right from TradingView charts — just choose a broker and connect to your account.
Crypto markets are famous for their volatility, so one should study all the available stats before adding crypto assets to their portfolio. Very often it's technical analysis that comes in handy. We prepared technical ratings for POLKADOT/TETHERUS (DOT): today its technical analysis shows the sell signal, and according to the 1 week rating DOT shows the sell signal. And you'd better dig deeper and study 1 month rating too — it's buy. Find inspiration in POLKADOT/TETHERUS trading ideas and keep track of what's moving crypto markets with our crypto news feed.
POLKADOT/TETHERUS (DOT) is just as reliable as any other crypto asset — this corner of the world market is highly volatile. Today, for instance, POLKADOT/TETHERUS is estimated as 2.26% volatile. The only thing it means is that you must prepare and examine all available information before making a decision. And if you're not sure about POLKADOT/TETHERUS, you can find more inspiration in our curated watchlists.
You can discuss POLKADOT/TETHERUS (DOT) with other users in our public chats, Minds or in the comments to Ideas.