DOT/USDT Long-Term Plan📈 Bullish Scenario
Conditions:
✅ Price holds above the critical support zone around $ 3.00 – $ 3.40 (Past Year Candle OHLC Low and Close).
✅ Volume confirms demand (increased buying near the yearly low).
Upside Targets:
First target: $ 4.07 – $ 4.35 → minor resistance & recent swing high.
Second target: $ 6.64 → major supply zone from previous structure.
Long-term target: $ 8.20 – $ 11.88 → historical supply zone if macro trend shifts and momentum strengthens.
Invalidation:
❌ Break and daily/weekly close below $ 3.00 with strong bearish volume. This would cancel the bullish setup.
📉 Bearish Scenario
Conditions:
✅ Price breaks below $ 3.00 and closes weekly candles under this level.
✅ No significant bullish volume reaction near the yearly low.
Downside Targets:
Immediate target: $ 2.50 → next psychological round number & historical pivot.
Extension target: $ 2.00 – $ 2.20 → deeper retracement to test major historical lows.
Continuation Trigger:
📉 Any failed retest of the $ 3.00 – $ 3.40 zone that flips this former support into resistance strengthens the bearish continuation.
🔍 Key Long-Term Takeaways
✅ The $ 3.00 – $ 3.40 zone is critical for the long-term trend.
✅ Watch for strong volume spikes and reversal candlesticks near support.
✅ A sustained reclaim of $ 4.35 could be an early signal of a broader trend reversal.
🗓️ Action Plan
Bullish Bias: If price holds above support, look for reversal signals with tight stop-loss below $ 3.00.
Bearish Bias: If support breaks, favor short or hedge setups toward $ 2.50 or lower.
Neutral Bias: If price stays in a tight range around $ 3.00 – $ 3.40, wait for a clear breakout direction.
📊 DOT/USDT Long-Term Trading Plan
Scenario: Bullish Reversal
Entry Zone: $ 3.10 – $ 3.40 (yearly support)
Stop Loss: Below $ 3.00
Targets: T1: $ 4.07 – $ 4.35 / T2: $ 6.64 / T3: $ 8.20 – $ 11.88
Notes: Wait for a daily or weekly reversal signal (pin bar, engulfing candle).
Scenario: Bearish Breakdown
Entry Zone: Close below $ 3.00
Stop Loss: Above $ 3.40
Targets: T1: $ 2.50 / T2: $ 2.00 – $ 2.20
Notes: Look for a failed retest of $ 3.00 – $ 3.40 as new resistance. Confirm with volume.
Neutral / No Trade: $ 3.00 – $ 3.40 (undecided zone)
⚖️ Risk/Reward Tip
For longs: RR ≥ 2.5 is recommended (target at least $ 4.35 with stop below $ 3.00).
For shorts: RR ≥ 2 is recommended (target at least $ 2.50 with stop above $ 3.40).
Position size accordingly to your risk tolerance; max 1–2% of capital per trade.
🔑 Key Confirmations
✅ Volume must confirm the breakout or breakdown.
✅ Look for multi-timeframe alignment: daily and weekly candles must confirm the move.
DOTUSDT trade ideas

UPDATE ON $DOTUpdate on CRYPTOCAP:DOT
Patiently wait for a pullback, there are some liquidity uncleared below, which aligns with our entry.
Patience is key.
Remember to Like, Comment and Share the post.
#DOT #POKADOT #BITCOIN

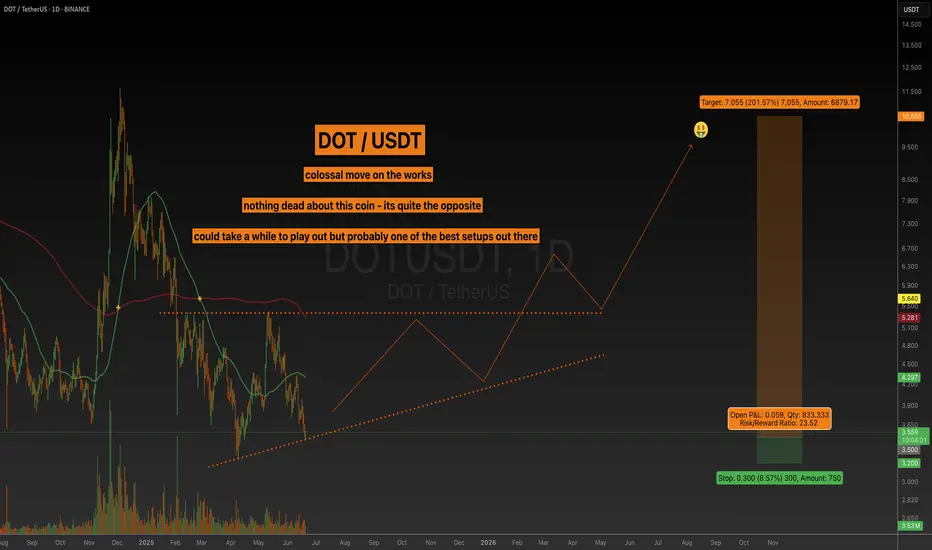
DOT - On The SpotEvening fellas,
Some say its dead, some say its asleep...
I'd stick with the second option, as to me, it's by far one of the best tech out there. Some say good tech doesn't matter, some say it does... Once again, I'll stick to the second option.
It could take a day, if they wanted... it might take years... but this is looking ahead, looking deep, looking for those big gains that change lives.
Trade thirsty...

POLKADOT on last supportI think $3 is the very strong support for DOT, and the blue zone will hold, and i believe $18 resistance is very reachable for the next few months after $10 resistance got broken.

Polkadot (DOT): Might Be Best Buy Entry, Might Be Not...Well, DOT is building up something here, where the price is at the local support zone, which has been holding the price pretty well.
SInce we touched that zone we have been also forming a smaller bullish trend which might result in an explosive movement towards the upper target zones (which would mean +50% of marketprice movement).
Swallow Academy

dotusdtThe DOT currency is in a very old daily demand zone and may start an upward move from these areas (this is just a personal opinion) Good luck
Wait for DOTDOT has been consolidating within the $3.30–$5.20 range for the past five months.
It’s now approaching a key trendline resistance. A breakout above this level would confirm bullish momentum—and signal a potential entry opportunity.
Disclaimer:
This analysis is based on my personnal views and is not a financial advice. Risk is under your control.

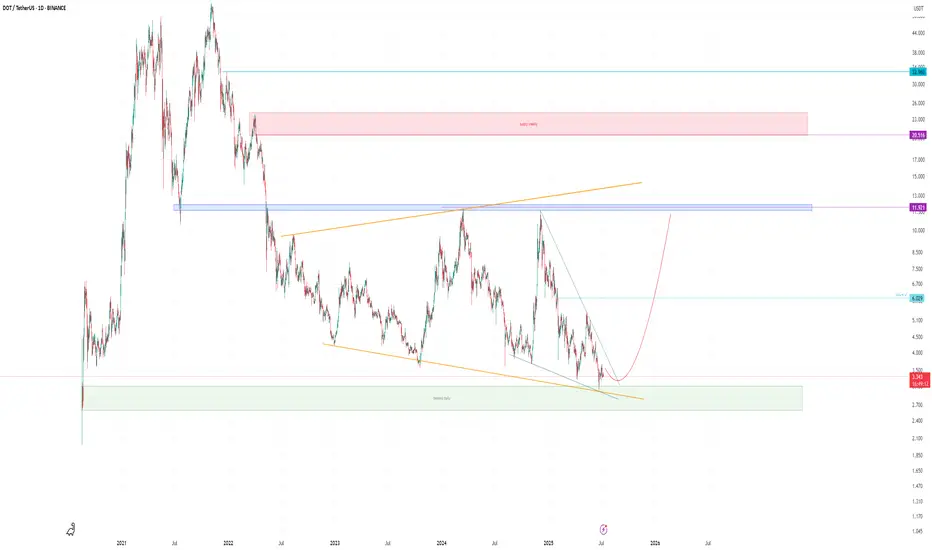
DOT/USDT Weekly Accumulation or Annihilation?📌 Overview & Market Context
Polkadot (DOT) is currently testing one of the most critical technical zones in its price history. Price action is revisiting a multi-year demand zone between $2.70 and $3.60, which has previously served as the springboard for explosive upward moves — including the 2021 rally to all-time highs near $55.
This weekly chart reveals that DOT may be transitioning from a prolonged downtrend into an accumulation phase, often seen before major bullish expansions.
🧱 Historical Support Zone & Technical Validation
🔹 The yellow demand zone ($2.70–$3.60) has acted as a strong support multiple times since 2020.
🔹 Price has once again bounced from this area, forming a potential triple bottom or accumulation base pattern, consistent with Wyckoff Accumulation Theory.
🔹 A confirmed bullish candlestick (e.g., bullish engulfing, hammer, or long-tail doji) on the weekly timeframe could signal early institutional accumulation and a potential macro trend reversal.
🟢 📈 Bullish Scenario: Strong Reversal Potential
If DOT successfully holds this support and forms a higher low, we could see a multi-leg bullish breakout, targeting the following resistance levels:
🎯 Target Price Level Significance
TP1 $4.75 First structural breakout
TP2 $5.88 Minor historical resistance
TP3 $7.63 Previous consolidation zone
TP4 $10.37 Major weekly resistance
TP5 $12.49–14.00 Extension zone during strong rallies
🧠 Note: A move from the current level to $14 represents a potential 250%+ upside — a major opportunity if confirmed by momentum and market sentiment.
🔴 📉 Bearish Scenario: Breakdown from Historic Support
A clean break below $2.70 with high volume would invalidate the bullish setup and signal:
Breakdown from a multi-year base structure.
Possible entry into a new bearish price discovery phase.
Next psychological support at around $2.00 or lower.
This scenario could materialize if:
Bitcoin or broader crypto markets turn bearish.
Macro factors worsen.
No strong demand appears from long-term holders.
⚖️ Strategy & Investor Insights
Swing Traders: Consider aggressive entries near current levels with tight stops below $2.70.
Mid-Term Investors: This is an ideal zone for DCA (dollar-cost averaging), with attractive long-term risk-reward.
Confirmation Needed: Watch for structure breakouts above $4.75 and momentum from RSI/volume indicators.
🧠 Market Psychology: Fear Breeds Opportunity
DOT is currently in what can be described as the “boredom phase” — the stage in market cycles when most traders have given up, and smart money quietly accumulates.
As Warren Buffet famously said:
> “Be fearful when others are greedy, and greedy when others are fearful.”
#DOTUSDT #Polkadot #CryptoReversal #AltcoinSetup #TechnicalAnalysis #SmartMoneyMoves #AccumulationPhase #SupportZone #BullishCrypto #BearishBreakdown

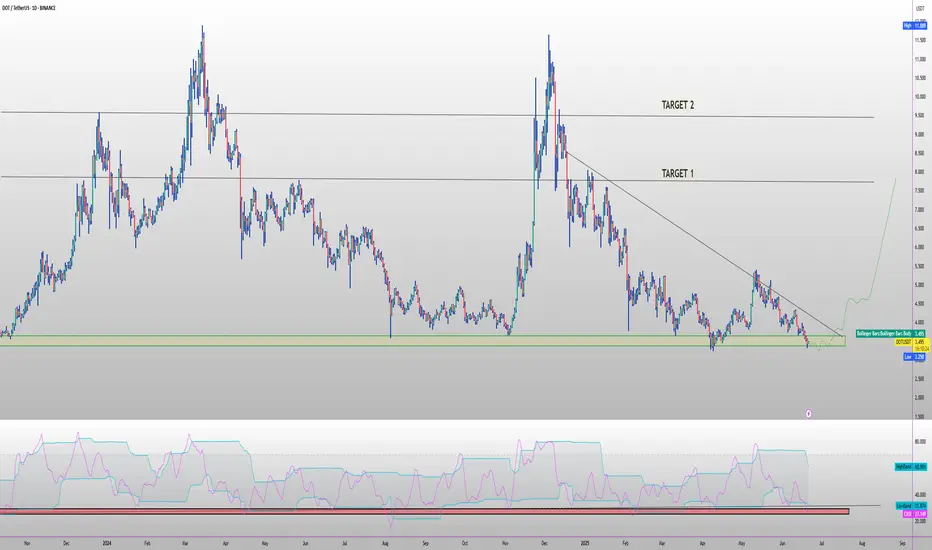
DOTUSDT is BullishPrice was in a strong downtrend, however the breakout from the descending channel hints a potential reversal. If a proper higher high is defined followed by a higher low then we can expect a bullish reversal as per Dow theory. Targets are mentioned on the chart.

DOT 4H Chart CorrectionI´m treating the recent upside as a corrective movement, and still expect a lower low. Reasons:
-> Upside does not look like a motive wave.
-> Lack of RSI divergence on the 4H or Daily Chart on the recent low.
I will look for reversals in the green resistance levels for short trades.

$3.48 Is the Line in the Sand—If DOT Holds, Next Stop $4.35DOT/USDT has shifted from a persistent downtrend into an early-stage recovery after forming a clear base near the stronger support area at $3.294. This accumulation zone attracted steady buying interest, eventually fueling a breakout past the previous resistance near $3.531, which has now become a support level.
At present, DOT is trading around $3.688, showing healthy momentum as it approaches the first resistance area. The recent price action demonstrates a breakout–retest structure that typically signals a continuation of bullish sentiment as long as key support levels hold.
The Chaikin Oscillator at the bottom confirms this accumulation phase, with sustained green histogram bars indicating that buying volume is building steadily. The indicator flipped positive before the breakout and continues to support the bias that bulls are in control on this timeframe.
There are two critical resistance zones ahead: the first around $3.974, which marks an interim profit-taking level, and the second near $4.345, a stronger barrier where sellers are likely to appear. If price closes above this higher zone with conviction, it would further confirm that the market has transitioned into a new bullish trend.
Trade Idea (Long Bias)
• Entry: Current area near $3.68 or on a small retracement toward $3.63–$3.60
• Stop-Loss: $3.480, placed just below the weaker support to protect against a deeper reversal
• Target 1 (TP1): $3.974, where partial profits can be secured
• Target 2 (TP2): $4.345, a more ambitious target aligning with the upper resistance
• Reward-to-Risk Ratio: Approximately 3.3, offering a favorable setup
As long as DOT stays above $3.531 and does not violate the $3.480 stop level, this bullish structure remains intact. If the price drops back below $3.480, it would suggest that the breakout has failed, increasing the likelihood of a retest of the accumulation zone around $3.294.
Overall, the combination of structural breakout, retest, and strengthening momentum indicators supports the idea that DOT may continue climbing toward the upper resistance levels over the next several sessions.

DOT ANALYSIS (3D)Polkadot appears to have reached a fresh and significant support zone, which is potentially where the corrective wave C may come to an end.
If wave C completes here, the price could begin a strong recovery. However, it’s important to note that this is a higher time frame setup, so reaching the targets may take some time.
As long as the green support zone holds, the price can move toward the mentioned targets. The targets are marked on the chart.
A daily candle closing below the invalidation level will invalidate this analysis.
For risk management, please don't forget stop loss and capital management
When we reach the first target, save some profit and then change the stop to entry
Comment if you have any questions
Thank You

Trading plan for DOT this weekTrying a new idea format
BINANCE:DOTUSDT On the chart, we can see a completed ABC upward correction pattern. Currently, we may expect a retest of the local low at $3.27, and after breaking the first support level, we could see a new rally toward the second resistance level at $3.7
Manage your risks accordingly

Polkadot (DOT): Should Jump By 120% | Might Jump By 1000%Polkadot has finally reached the 200EMA mark and might be off to a bright start here. The pattern seems to repeat, and we are starting to enter the bull market so eyes wide open now!
More in-depth info is in the video—enjoy!
Swallow Team

SHORT - DOTUSDTShort the imbalance at 4.890.
Fibo confluence at the 0.5.
Order flow showing single prints at the imbalance area at 3.495
Net short increase on ByBit at 07:30. Shorts sitting around 3.464 => beware of a squeeze.

Prepare for long DOTUSDTif complex / corrective pattern took place, there is high chance to go long. BINANCE:DOTUSDT

dotusdtdotusdt is testing the trend line . dca time for dot .good area for exposure to dot at this time .spot only dca on every new low weekly

DOT PLAN FOR 2025🔥 MIL:DOT long setup (1D) 🚀
✅ Entry Zone: $3.10 – $3.40 (triple-tested demand)
🎯 Targets
• TP-1: 8.80 (’24 breakdown line)
• TP-2: $10.40 (pre-bear support)
⛔ Stop-Loss
Daily close < $2.5
📊 Thesis
Polkadot 2.0 is rolling out NOW: Agile Coretime marketplace, JAM smart-contract hub & 6-sec blocks via Asynchronous Backing. On-chain OpenGov controls a 508 M DOT treasury, while DeFi hubs (HydraDX, Moonbeam) just posted 200 %+ QoQ tx growth. Active accounts up 35 % YoY, >50 % of DOT already staked, and a Grayscale spot-DOT ETF is in the SEC queue. 🔥 risk-reward.
Polkadot - BEWAREI have been checking out some news and fundamentals lately on this coin.
LMAO makes me laugh people still look into trading memes, investing, whatsoever... Those might get burned once again, cause this BTC.D party aint nowhere to being done. It will continue to remove liquidity from coins with no use case.
Over 30 MILLION coins, and starting today, 99% of them will not recover!
Polkadot will though, BCH will, AVAX will, LINK will, well you get the drill.
This post is about DOT so i'll focus on it. Theres HUGE interest in these levels, and different than a lot of coins it hit a perfect .886 fib and is bouncing creating a massive Ascending Triangle, that most likely will finish by next year. Thats a good 6 months from now, but its worth it.
As a matter of fact, I dont think I could name 3 other coins that in the long run will out perform DOT. Right now they are, SOL for instance is... but I dont think SOL will out perform in a few years as DOTs fundamentals are way heavier.
DOTUSDT Long IdeaPolkadot appears poised for a potential move, having taken liquidity and expanded impulsively. The recent fill of the fair value gap (FVG) at the consequent encroachment level, coupled with holding above the order block, suggests a bullish outlook. Continued accumulation at these levels could potentially lead to higher targets in the coming weeks.
Please note, this is not financial advice; manage your risk accordingly.
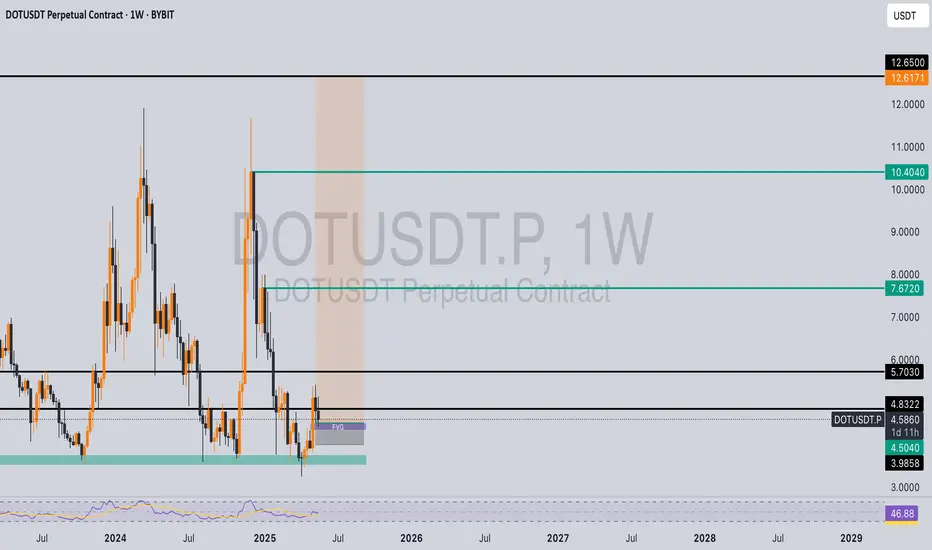
DOTUSDT 1W AnalysisDOT ~ 1W Analysis
#DOT Buy back gradually from this support block with a short term target of at least 20%+ from this support.

Polkadot (DOT): Strong Signs of Potential Bullish MovementPolkadot caught our attention with rather good potential for upward movement from here, which can be seen both on 30M timeframe and 4H timeframe
More in-depth info is in the video—enjoy!
Swallow Academy

DOT/USDT - Bullish On the 4-hour chart, DOT/USDT has shown a clear bullish rejection from its significant horizontal support zone around $3.80 - $3.85. This strong bounce indicates robust buying interest at this critical level, signaling a potential reversal and a buying opportunity. The price action here underscores the validity of this support, suggesting diminishing selling pressure.
While a descending trendline remains overhead as dynamic resistance, the current rebound sets the stage for a potential challenge to this overhead barrier. A confirmed break above this trendline would further strengthen the bullish outlook. Traders may consider long positions with a prudent stop-loss placed below the $3.80 support to manage risk effectively.
