DOT Fake OutWho is at the helm of the U.S. economy....right now....? Enough Said. What just happened was a fake out. To many countries are about to start dumping US bonds....no real rally for a while I'm afraid.
DOTUSDT trade ideas

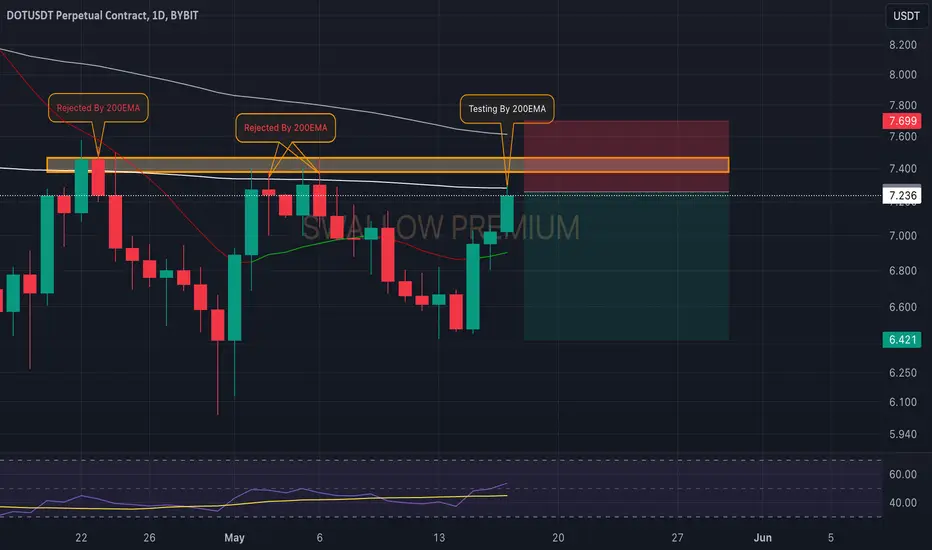
Polkadot (DOT): Keep an Eye on 200EMA !!!We are back with Polkadot, where our attention has caught that 200EMA which has been holding its ground since April 22.
We are now yet again back at 200EMA testing it, and we are looking for a potential rejection to happen from here. If we see it, we should see a nice downward movement from here!
Swallow Team
POLKADOT AMONG MY PICKS FOR ALT SEASON
This could be Polkadot for the bull run. Price might retrace to $5.6 but i highly doubt it with the presence of strong volume an relative strength index already above the previous high syncing with the price action, it is a strong indication of buyers taking charge and imminent price surge.
Again as I have emphasised on previous analysis, do not time a perfect entry just accumulate for the ALT SEASON and expext at least x3-5.
OTHER ANALYSIS

DOT Monthly Forecast for 2024 - ImageHere is my view for DOT
I think we are in a good spot to take a long

DOT - Monthly Chart - View for 2024DOT chart, i feel we are in a good spot to buy this here for a nice move up.

Buy today, and we'll see you in December 2024.I feel that today is still a good buying opportunity. There were people who bought at $10 thinking it was cheap, although today it is 50% cheaper...
Now, logically, you should have been buying. An excellent entry point was buying DOT at less than $5, ideally in the $4 range. However, if you haven't bought yet, don't regret buying DOT at $1 more. It's worse to buy when it's already at $7 in this Christmas rally.

DOT ANALYSIS (6H)From where I inserted "Start" on the chart, it seems that the price entered a correction.
This correction is a triangle or a more complex pattern (diametric or symmetrical).
From the green area, it can move towards the targets.
Closing a daily candle below the invalidation level will invalidate the analysis
For risk management, please don't forget stop loss and capital management
When we reach the first target, save some profit and then change the stop to entry
Comment if you have any questions
Thank You

Dot Making two scenarios one is bullish second one is BearishDot is testing the 200 EMA a key level holding strong since 22nd April. Butt at the same time it already break the descending trendline which make a bullish trend. As we see market is already in Bullish Mode so i am expecting a 30% bullish movement once it break 7.50 with Sl 6.20. Once it break the EMA 200 you can easily aim for 8,10 and the final one is 11,

#DOT Possible Scenario 🔥#DOT Possible Scenario 🔥
Bounce from Trendline
Bounce from support zone
High volume breakout.
See you on the Moon 🌙

DOT We see a classic ascending triangle pattern in the chart. In my opinion, this is one of the best positions in the market. Good luck

DOT We see a classic ascending triangle pattern in the chart. In my opinion, this is one of the best positions in the market. Good luck

DOTUSDT Dotusdt is in bearish trend testing fib 0.5-0.618 with channel top making LH , with no divergence at bottom

$DOT weakening structure#polkadot #dot price chart is exhausted after the relief rally, needs some correction in MID TERM, not short term. Not financial advice.


DOTUSD 1WDOT ~ 1W
#DOT We hope that this Support Block will be retested again. And we wouldn't hesitate to place a sizable purchase here. with a long-term target of at least 25%+

UPDATE ON POLKADOT - FINAL MOVE BEFORE THE BULL RUN
First of all you should see this scenario for CONTEXT.
Look at how perfectly price have been reacting to this chart. Here is an update with a potential 3RR trade setup. I feel... why not take advantage of the opportunity that presents itself but don't forget this is just us trying to make money on both bear and bull market the overall target on the mid - long term still remains bullish and our next DCA region is within the box below (typically where we will be taking profit for the SHORT trade). BINANCE:DOTUSDT
The ideal Entry is $7.746 being 1:1 if this potential wave 4-green turns out to be a Flat while the invalidation / stop loss is $8.509 (approximately 10%) and take profit is at $5.446 (3RR) approximately 30%
But it is possible we miss that perfect entry if the POTENTIAL wave 4-green turns out to be a Triangle as shown on the chart. So if you're not looking for perfect entry, you can also position from this point the only not so good news is that the risk reward ratio become 2 thereabout.
EDUCATION
This section is for those who still can't fully interpret my chart. so you noticed from the explanation above concerning the trade setup. There are 2 scenarios but represent on one chart and differentiated using the DOTTED & DASHED LINE. This is how you understand my charts when you see these lines.
I also believe you now know why you should also read every chart descriptions coz if you didn't read the one above now you'll have to go read it and for those that didn't read it at all :)skull.
OTHER ANALYSIS

Polkadot (DOT): Touching Again EMAs (100&200) Polkadot has again reached the zone of EMAs and is currently looking pretty strong.
We are now keeping an eye on a potential rejection from our current zone. If we get one, movement to lower zones will start (as it has been after rejecting EMAs).
Swallow Team

polkadotdot Technival analysis basically on elliott waves Principles
dot can be make a new high and i guess it can be 44$
wait and watch

DOT Intraday Buzz: Dive into Profit Potential Now!The chart highlights breakout/rejection points, criteria, and targets to execute on the trade opportunity.
Find more in the signature!

DOT is likely to head towards monthly resistance around 20The price has been consolidating on the weekly and monthly support WS1+MS1 area for quite some time and looks like ready to take off from here. I think the path is clear to travel from here up to monthly resistance around 20.

DOT/USDT descending channel what next?👀🚀DOT analysis💎 Paradisers, #DOTUSDT is currently nicely tracking a channel trajectory. Will this lead to a swift continuation of the prevailing downtrend, or are we entering a period of uncertainty for sellers? Let’s explore what’s likely to happen next.
💎 It's important to highlight that #DOT has broken below both the downtrend trendline and the 200-day Simple Moving Average (SMA) on the daily chart. This bearish behavior indicates that bears are firmly in control, suggesting a likely continuation of the downtrend.
💎 Currently, #POLKADOT is positioned near a channel resistance that might attract potential sellers. Yet, we must be wary of potential price spikes upward, often seen as "stop-loss hunting" events. Such movements can introduce temporary volatility and challenge the prevailing bearish sentiment.
💎 However, as long as #DOT remains under the crucial supply zone level of $7.531, the scales are tipped in favor of a continued bearish trend. Should the price break above this supply level, then a bullish shift might be on the horizon. Staying vigilant and trading wisely is essential for success in these market conditions.
MyCryptoParadise
iFeel the success🌴

take a short on the dot as a positional traderthe short sign just under a S & R zone .risk of around 1:1.24 percent .looks savvy

Polkadot📊Analysis by AhmadArz:
This is the time when we are looking for the best points to buy in this chart so that we can double the capital.🚀
🔗"Uncover new opportunities in the world of cryptocurrencies with AhmadArz.
💡Join us on TradingView and expand your investment knowledge with our five years of experience in financial markets."
🚀Please boost and💬 comment to share your thoughts with us!
