DOT 4H Chart CorrectionI´m treating the recent upside as a corrective movement, and still expect a lower low. Reasons:
-> Upside does not look like a motive wave.
-> Lack of RSI divergence on the 4H or Daily Chart on the recent low.
I will look for reversals in the green resistance levels for short trades.
DOTUST trade ideas

Trading plan for DOT this weekTrying a new idea format
BINANCE:DOTUSDT On the chart, we can see a completed ABC upward correction pattern. Currently, we may expect a retest of the local low at $3.27, and after breaking the first support level, we could see a new rally toward the second resistance level at $3.7
Manage your risks accordingly

Polkadot (DOT): Should Jump By 120% | Might Jump By 1000%Polkadot has finally reached the 200EMA mark and might be off to a bright start here. The pattern seems to repeat, and we are starting to enter the bull market so eyes wide open now!
More in-depth info is in the video—enjoy!
Swallow Team

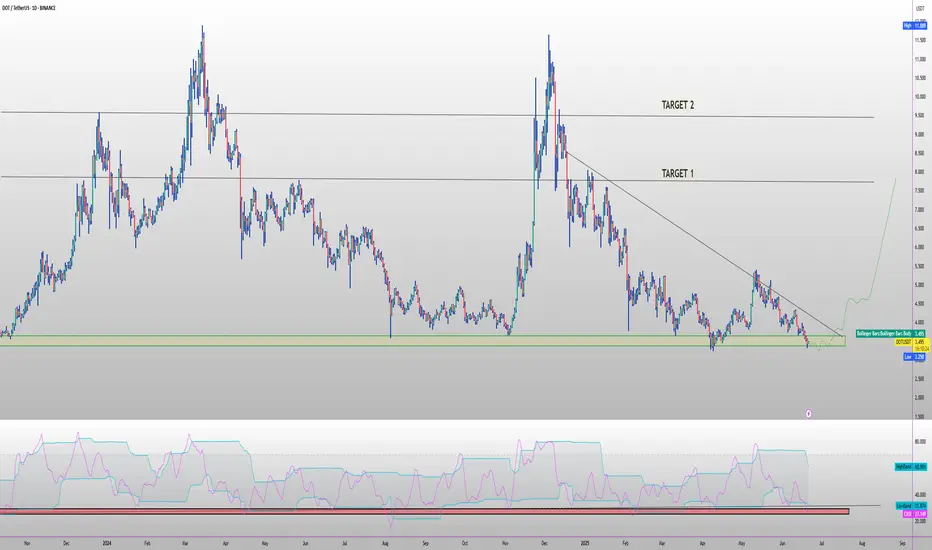
DOT ANALYSIS (3D)Polkadot appears to have reached a fresh and significant support zone, which is potentially where the corrective wave C may come to an end.
If wave C completes here, the price could begin a strong recovery. However, it’s important to note that this is a higher time frame setup, so reaching the targets may take some time.
As long as the green support zone holds, the price can move toward the mentioned targets. The targets are marked on the chart.
A daily candle closing below the invalidation level will invalidate this analysis.
For risk management, please don't forget stop loss and capital management
When we reach the first target, save some profit and then change the stop to entry
Comment if you have any questions
Thank You

Prepare for long DOTUSDTif complex / corrective pattern took place, there is high chance to go long. BINANCE:DOTUSDT

dotusdtdotusdt is testing the trend line . dca time for dot .good area for exposure to dot at this time .spot only dca on every new low weekly

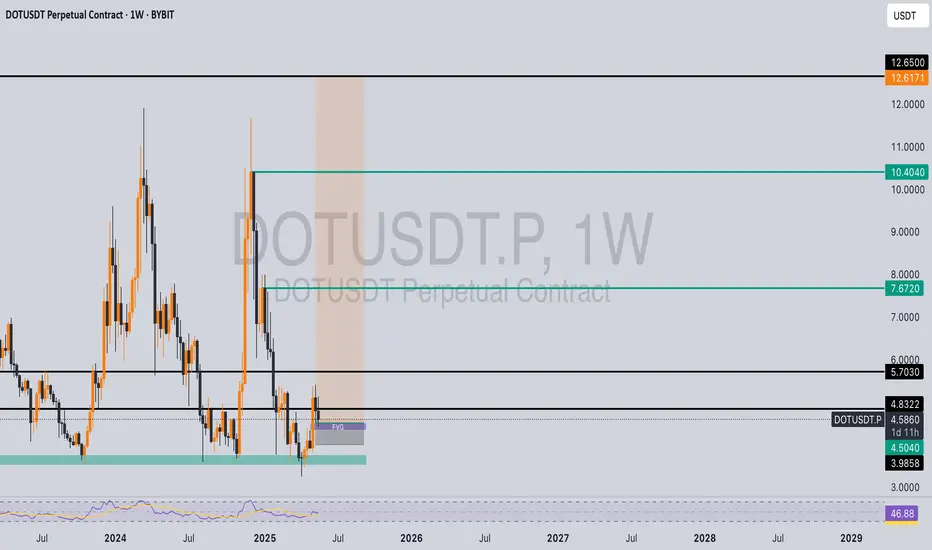
DOT PLAN FOR 2025🔥 MIL:DOT long setup (1D) 🚀
✅ Entry Zone: $3.10 – $3.40 (triple-tested demand)
🎯 Targets
• TP-1: 8.80 (’24 breakdown line)
• TP-2: $10.40 (pre-bear support)
⛔ Stop-Loss
Daily close < $2.5
📊 Thesis
Polkadot 2.0 is rolling out NOW: Agile Coretime marketplace, JAM smart-contract hub & 6-sec blocks via Asynchronous Backing. On-chain OpenGov controls a 508 M DOT treasury, while DeFi hubs (HydraDX, Moonbeam) just posted 200 %+ QoQ tx growth. Active accounts up 35 % YoY, >50 % of DOT already staked, and a Grayscale spot-DOT ETF is in the SEC queue. 🔥 risk-reward.
Polkadot - BEWAREI have been checking out some news and fundamentals lately on this coin.
LMAO makes me laugh people still look into trading memes, investing, whatsoever... Those might get burned once again, cause this BTC.D party aint nowhere to being done. It will continue to remove liquidity from coins with no use case.
Over 30 MILLION coins, and starting today, 99% of them will not recover!
Polkadot will though, BCH will, AVAX will, LINK will, well you get the drill.
This post is about DOT so i'll focus on it. Theres HUGE interest in these levels, and different than a lot of coins it hit a perfect .886 fib and is bouncing creating a massive Ascending Triangle, that most likely will finish by next year. Thats a good 6 months from now, but its worth it.
As a matter of fact, I dont think I could name 3 other coins that in the long run will out perform DOT. Right now they are, SOL for instance is... but I dont think SOL will out perform in a few years as DOTs fundamentals are way heavier.
DOTUSDT Long IdeaPolkadot appears poised for a potential move, having taken liquidity and expanded impulsively. The recent fill of the fair value gap (FVG) at the consequent encroachment level, coupled with holding above the order block, suggests a bullish outlook. Continued accumulation at these levels could potentially lead to higher targets in the coming weeks.
Please note, this is not financial advice; manage your risk accordingly.
DOTUSDT 1W AnalysisDOT ~ 1W Analysis
#DOT Buy back gradually from this support block with a short term target of at least 20%+ from this support.

DOT/USDT - Bullish On the 4-hour chart, DOT/USDT has shown a clear bullish rejection from its significant horizontal support zone around $3.80 - $3.85. This strong bounce indicates robust buying interest at this critical level, signaling a potential reversal and a buying opportunity. The price action here underscores the validity of this support, suggesting diminishing selling pressure.
While a descending trendline remains overhead as dynamic resistance, the current rebound sets the stage for a potential challenge to this overhead barrier. A confirmed break above this trendline would further strengthen the bullish outlook. Traders may consider long positions with a prudent stop-loss placed below the $3.80 support to manage risk effectively.

DOT/USDT High win rate scalping signals in 15 minutes (TEST)- Signal: Empty
- Entry: 3.778 ~ 3.782
- Take Profit: 3.761, 3.748

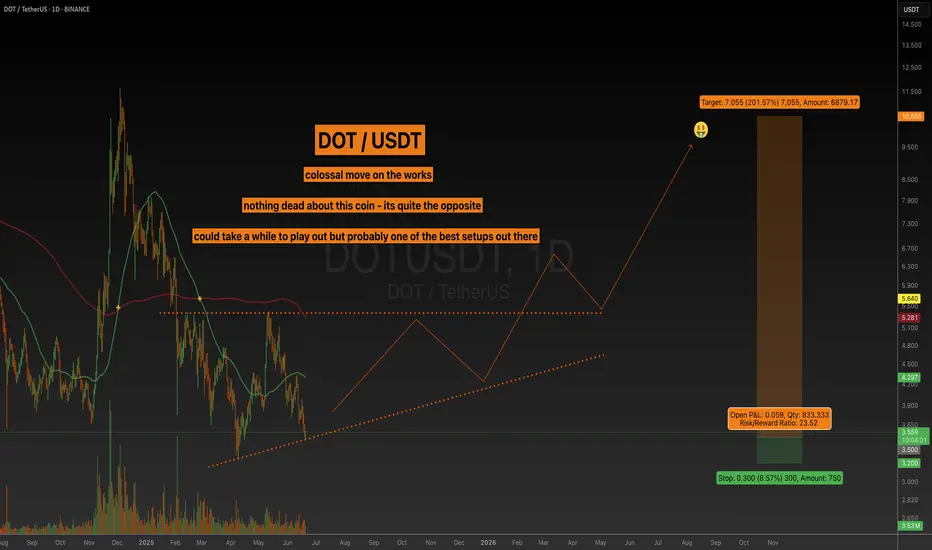
DOT Will Pump 200% Next Few MonthsWe are headed to 12$ - 11$ over this year - Profiting 200%
STOP LOSS : Dailly Close Bellow 3.30$ (-15%)
Low Risq Big WIN!
Not Financial Advice , But I'm in Baby ;)
CRYPTOCAP:DOT BINANCE:DOTUSDT COINBASE:DOTM2025 BYBIT:DOTUSDT.P BYBIT:DOTUSDT COINBASE:DOTUSDT BINANCE:DOTBTC


#DOTUSDT 3D Analysis — Triple Base Defense, Macro Wave Ready?🎯 #DOTUSDT 3D Analysis — Triple Base Defense, Macro Wave Ready?
🗓 Published: May 22, 2025
📊 Timeframe: 3D | Exchange: Binance
Author: @HamadaMark
🔍 Technical Overview
DOT has confirmed a triple bottom structure over 18+ months, defending the same demand zone around $2.9–$3.6.
This zone has acted as a launch base for all major rallies since mid-2023, and we're now setting up for another potential macro leg.
📌 Pattern Insights:
✅ Triple base with equal lows
✅ Falling wedge breakout (past) with measured rallies
✅ Major structure respected — bulls still in control
✅ Weekly momentum flipping from deep oversold
🟦 Key Support Zones:
Main Support: $3.615 – structural neckline
Final Floor: $2.929 – cycle base
📛 Panic Level: Daily/3D close below $2.9 = invalidation & full reset
🎯 Target Zones (Next Macro Leg):
TP1: $5.683 – structure resistance
TP2: $7.676 – major horizontal supply
TP3: $9.459 – breakout zone before 2024 top
TP4: $16.237 – macro range high (2021 echo)
📈 Current setup offers +140% upside to TP3 with a clean R:R of ~7.84 from entry
🧠 Strategy Insight
• DOT is a macro structure play — entries near $4 are ideal
• Add size if price reclaims $5.68 with volume
• Swing traders may hold partial exposure into Q3–Q4
• SL below $3.6 or $2.9 depending on position size + risk appetite
💡 When altcoins defend the same base 3x, that level becomes legendary.
🗣 What’s Next?
Hold → push toward $5.68 → consolidation → leg toward $7.6+
Break below $3.6 = caution
Close below $2.9 = reset
📢 DOT is quietly building energy. The longer it holds this zone, the harder it breaks out. Respect the base.
we ask Allah reconcile and repay

DOTUSDT|1H ANALYSIS🔍 In the 1-hour timeframe, DOT is currently holding above a valid ascending trendline 🔻 which has acted as support multiple times and prevented further downside 🛡️📉
This suggests that buyers are stepping in at lower levels, showing accumulation interest 🧲💰
👁️🗨️ Now, the price is approaching a key resistance zone around 4.204 🚧🔥
This level has previously rejected price action multiple times and is now being tested again! 😤📍
🛎️ Keep an eye on volume, confirmation candles, and beware of fake outs❗🔍
Monitor the chart closely, as market conditions can shift quickly ⏳⚠️
📅 Analysis Date:
📢 Drop your thoughts in the comments – I’d love to hear your outlook on DOT 🤝💬
If you enjoyed this analysis, don’t forget to like and follow for more updates ❤️🙌
#DOT #Polkadot #CryptoAnalysis #TechnicalAnalysis #TradingView #CryptoSignals #TA #Bitcoin #Altcoins

DOT.Give me some energy !!!What I currently expect is that the price could correct slightly, as shown on the chart, and then pump by about 18% from the PRZ (Price Reversal Zone). This signal is strengthened by the presence of strong positive divergence. In summary, the PRZ is a good entry point, derived from the confluence of touchlines and pivots. However, if the price ignores this zone and drops below it, my analysis will be invalidated.
Best regards CobraVanguard.💚

DOT/USDT – Trendline breakout confirmedHere’s a trading idea for DOT/USDT:
---
DOT/USDT – Trendline breakout confirmed
DOT has confirmed a breakout above its descending trendline, signaling a potential shift in momentum. If the price holds above the breakout level, a 10–20% pump could follow in the short term.
Key levels to watch:
– Breakout support zone
– Volume confirmation
– Immediate resistance ahead
Hold above the trendline could lead to further bullish continuation. Keep it on your radar.

DOT – Descending Triangle Setup & Support ReactionDOT is shaping up within a descending triangle pattern on the daily chart 📉. Price is currently testing the support zone — this level is key for what comes next 🚀. Will DOT gather strength to break out of the triangle, or will sellers keep the pressure on? It’s a critical juncture for this altcoin 👀. Stay tuned for the next move! GATEIO:DOTUSDT

$DOT Setup: Watch This BreakoutCRYPTOCAP:DOT is trading in a clear range between $3.544, $4.022 support and $10.132, $12.564 resistance.
The current pullback to the demand zone hints at potential accumulation.
A breakout above $12.423 could trigger a strong rally toward $23.654, $32.756, $53.172, and higher.
DOT is gearing up for a major move once resistance clears.
DYRO, NFA

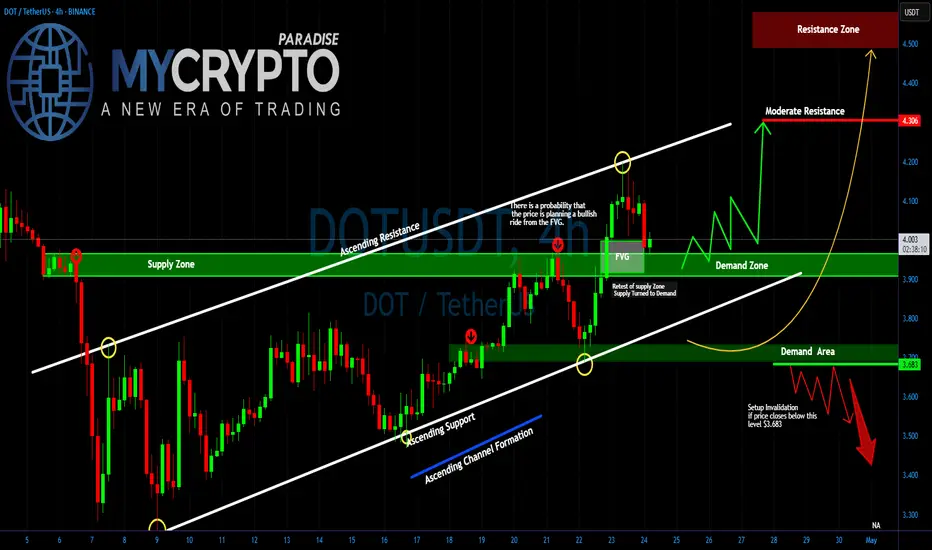
DOT/USDT About to Explode or Crash?Yello Paradisers! Are you ready for DOT's next explosive move, or will you be caught in the trap again? Right now, #DOTUSDT is sitting at a key decision point inside a textbook ascending channel — and what happens next could either print profits or wipe out the unprepared.
💎After respecting both the ascending resistance and support lines with high precision, it has now pulled back into a crucial area of interest: the Fair Value Gap (FVG). If DOT continues to hold above this level, the probability of a bullish continuation increases significantly. The area around $3.90–$3.95 is aligning perfectly with the demand zone, adding to the confluence and giving bulls a strong foundation to build on.
💎However, the real test lies ahead. POLKADOT must clear the immediate resistance around $4.10–$4.30 for the bullish momentum to gain traction. A successful break and retest of the $4.30 level would likely open the doors to a fast move toward the high-value resistance zone at $4.50 and above.
💎But here’s the twist: if DOT fails to defend the demand zone and instead closes below $3.683, the entire bullish setup becomes invalid. Such a breakdown could trigger a deeper correction, targeting the $3.40 region and possibly flushing out the overleveraged players in the process.
Stay focused, Paradisers. Be the hunter, not the hunted
MyCryptoParadise
iFeel the success🌴
PolkaDot (DOT) Structure Analysis (1D)BITGET:DOTUSDT is showing signs of strength after a deviation below the long-standing $3.70–$4.10 demand zone.
Key Levels
• 🟢 Demand Zone: $3.70–$4.10, respected since October 2023
• 🟡 Broken downtrend resistance, retested as support
• ⚪ Current falling channel (compression) following range high retest
• 🟥 Sell Order Block: $5.10–$5.40
• 🟧 Range Resistance: $5.40
• 🎯 Target on breakout: ~$7.00, potential extension to ~$7.50
Thesis
• The recent breakdown was quickly reclaimed, hinting at a possible spring/fakeout. After retesting the range high, price is now compressing within a descending channel, building energy just above demand.
• A breakout from the channel followed by an S/R flip of the $4.40–$4.60 region could trigger a rally toward the upper range.
Watching for
• Channel breakout with volume
• Clean break above $5.40 to confirm range expansion
Invalidation
• Sustained break below the $3.70–$4.10 demand zone

#DOTUSDT: Targeting $50 By End Of The Year! Wait For Volume ? Hey everyone!
So, about DOTUSDT, it’s been trading sideways at $4 lately. However, it has the potential to break through and hit new highs in the coming weeks or months. We’re not sure exactly what will happen next, but once it does, we expect it to start distributing its value. If this happens, we could see it reach our $50 mark by the end of the year.
I know this is just our speculative view, and we can’t rely solely on technical analysis to make this happen. We also need strong fundamental support. But hey, it’s worth a shot, right?
If you like our work, please give it a like and let us know what you think in the comments. We’d love to hear your thoughts!
Wishing you all the best and happy trading! 😊
We really appreciate your unwavering support! ❤️🚀
And if you’d like to lend a hand, here are a few ways you can contribute:
- Give our ideas a like
- Share your thoughts in the comments
- Spread the word about our ideas
Cheers,
Team Setupsfx_
