DOW Inc | DOW | Long at $27.59NYSE:DOW Inc is a strong company with good fundamentals currently trading at a good value (it just may take time for the value to truly show).
P/E = 18x
Dividend Yield = 7.74%
Price/Cahs Flow = 6.9x
Debt/Equity = 0.94x
Price/Book = 1.14x
Insiders buying and awarded options
Thus, at $27.59, NYSE:DOW is in a personal buy zone.
Targets:
$34.00
$40.00
$44.00
DOW trade ideas

Swing Long For DOWProcessing manufacturers and utility companies are all safe bets right now in an overall bearish market. A company like DOW is severely underpriced right now, so I'm long for the long haul.

DOW. LONG IDEA.Hello!
I'm long dow from the box. First price target is around $50. If we gain $50, I expect all time highs. If we start breaking down from the box, it will probably be new lows.

DOW 20% Potential move. Dow looks primed to hit some targets. Avg Vol and today's Vol are even. Let's see if buyers step in and lift this higher.

DOW has a daily RSI at 26 and a div yield @ 7%Dow is trading at a 5 year low with an attractive yield of 7+ % . They are one of America's worst polluters and have been the target of the EPA for years. We're about to get a new President that absolutely hates the EPA. That may not be good for the environment, but it's probably very good for DOW.

Can DOW survive?Breaking that lower support line was not good. With the upward pullback channels starting to flatten out, will DOW turn around before January? Have to decide to roll options if there's any chance of it targeting $50/sh. Risky, risky. Good luck.


Dow long term ideaI showed my long-term forecast for the Dow index on the chart. People who pump fear into you are making money from it. Everything will be better in this world. It is a good thing to live. I also pointed out the target and the levels that will be needed on the chart. Why don't you try to look through my eyes. Of course, it is useful to be realistic. This will not happen right away. Smart people understand. Look at my past analyses and my profile. Don't forget to follow :) good luck

DOW, nice looking short term option tradeBulls are tired on SPX, its a doji. Looks like a perfect start. Godspeed. NYSE:DOW

DOW: inclining channel pattern at playA price action above 58.00 supports a bullish trend direction.
Bullish confirmation for a break above 60.00.
The target price is set at 62.00 (at the upper range of the inclining channel pattern).
The stop-loss price is set at 57.00 (at its 38.2% Fibonacci retracement level).
Remains in a well-established inclining channel pattern.
Favourable win/loss ratio applicable.

Dow market analysisA potential of 44% was detected against a temporary loss of 22% from the current level. Taboo this does not happen immediately. Patiently accumulate positions in the direction of the long-term goal. I don't expect the price to operate below 53.73, but if that happens, we should wait from 53.73 towards 46.10 and increase the position here. It will result in monetary expansion over a long period of time. Contrary to popular belief, stock markets are not falling markets. The chart wave structure is suitable for long positions. The psychological basis and the world conjuncture will bring the position target shown on the chart. It points to the change in dynamics that cause prices to remain under pressure for a long time. Ignoring the fluctuations, the strategy was determined in the direction of the target

Dow Inc.: Knock Knock…✊The price of the Dow Inc. is currently trying to overcome the resistance at 57.74. We expect that the price will succeed and continue the uptrend until the magenta wave (Y) reaches its top. In the short term, there is a 36% probability that another corrective low will be made, which will be confirmed if the support at $52.64 is lost.

DOW breaking out of it's downtrend?DOW Inc. had been downtrending for quite some time (since it made a double-top peak in April of '22). But, I'm seeing signs of life. On the monthly timeframe, it's squeezing with rising momentum. On the weekly timeframe, the squeeze fired 2 bars ago and, there's a Daily squeeze primed to fire long. Combine that with the fact that it just formed a nice cup & handle as it broke through the downtrend line and I think the squeeze could provide enough juice for a run up to that resistance just in time for earnings.

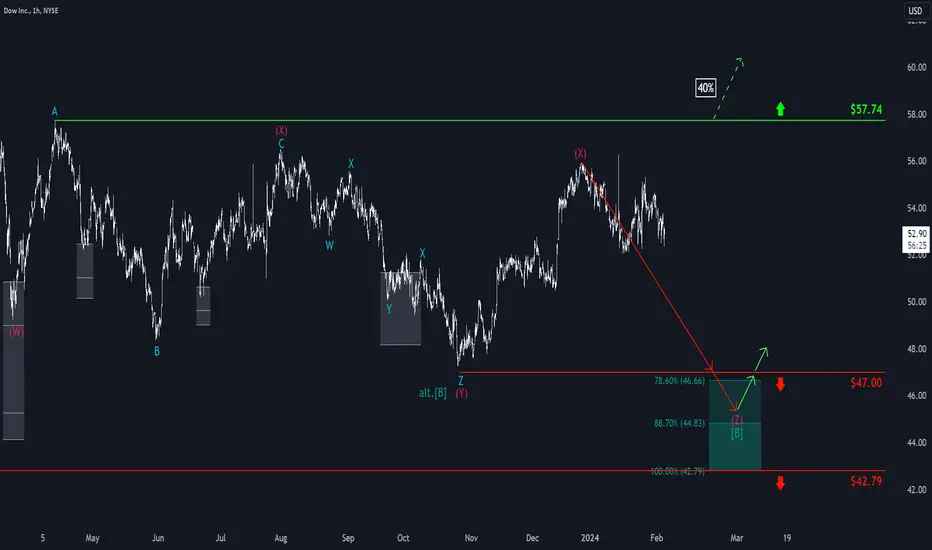
Dow: Heading South 👇We continue to locate the Dow stock in the bearish wave (Z) in magenta and expect the price to fall back to our dark green Target Zone on the south side (coordinates: $46.66 - $42.79). Traders could place a stop for long positions 1% below the lower edge of the Target Zone, or in this case 1% below the support level at $42.79. However, it should be noted that our alternative scenario has a 40% probability and would see break above the resistance level at $57.74. Wave alt. (B) in dark green would have already been completed in this scenario.
EOY Review $DOW how to make 0,11 $ in 4 years....NYSE:DOW a great example why long term investing doesn't always beat shorter term speculating/trading
current price at same level as EOY '19....
closed the 2 down quarter green, above the low of previous quarter = positive
inside year = no clear direction, until market gives us new clues = neutral
anything can happen

The Dow Inc, momentum play.Patience + buy limits around 49-50 USD region.
Daily key levels and 4h resistance zones have held.

DOW I Continued strong development is indicatedWelcome back! Let me know your thoughts in the comments!
** DOW Analysis - Listen to video!
We recommend that you keep this pair on your watchlist and enter when the entry criteria of your strategy is met.
Please support this idea with a LIKE and COMMENT if you find it useful and Click "Follow" on our profile if you'd like these trade ideas delivered straight to your email in the future.
Thanks for your continued support!

DOWJONES IS BULLISHHey Traders, DOW is on the bullish trend, based on the 4HR timeframe and confirmation of the 61.8% Fibb Retracement with the Golden Buy zone, with the potential of hitting the TP4 by next few 2-3 weeks, Enjoy your profits.

💵 E a r n i n g s J o u r n a l📶 S T A T I S T I C A L A N A L Y S I S
Current 50-Day Market Trend: short/sellers/negative.
Next Swing: positive swing to resistance.
Next Wave: buy wave to the deviation.
Next 50-Day Market Trend: long/buyers/positive.
Trade Type: Touch & Go don't wait for a close.
💵 E A R N I N G S A T A G L A N C E
Release Date: 10/24 BMO
Quarter: FQ3'23
_______________________________________________
Revenue Anticipations: positive surprise of Revenues.
Revenue Surprise-Confidence: on a scale of 0-9, #5
Revenue 2-Year Trend: the company trend in Revenues is negative.
_______________________________________________
EPS Anticipations: positive surprise of EPS.
EPS Surprise-Confidence: on a scale of 0-9, #5
EPS 2-Year Trend: the company trend in EPS is negative.
_______________________________________________
📝 S Y N O P S I S
🟢BUY: If the earnings report is above the Wall Street consensus, I expect the market will buy the +surprise.
⚪NEUTRAL: If the earnings report is released with complicating press, I expect the market will avoid the surprise and invest in alternative securities.
🔴SELL: If the earnings report is below the Wall Street consensus, I expect the market will sell the -surprise.
🔎 R E S E A R C H D E P T H
Technical Analysis: daily chart.
Fundamental Analysis: EPS & Revenue data.
Press/News: none.
Social Media: none.

Review of Thursday 21-9-23 Trading for our VIP ChannelIn depth Review for our Traders on our VIP Service.
Review of our Trades from Thursday 21/09/23.
*** Take a look at our profile and feel free to leave us a Like ***
*** If you like the content and want to keep up to date, Please Follow ***

DOW: Downhill ⛷️Within the turquoise B wave, the Dow is currently in a downtrend. We expect this decline to continue to the turquoise target zone between $51.53 and $48.47, where we expect the reversal to occur. If the bulls prevent a decline until then and push the price above the resistance at $56.49, which we consider to be 34% probable, the price would establish the high of the magenta wave alt. a little higher.

#DOW resistance level based on option sentimentThe level indicated on the chart does not guarantee that the stock will directly reach the specified price level, but a bounce and a surge in sales are highly likely when it is reached.

DOW: might it break higher?A price action above 52 supports a bullish trend direction.
Further bullish confirmation for a break above 54.00.
The target price is set at 56.00.
The stop-loss price is set at 51.00 (200-day).
Is a symmetrical triangle pattern busy developing?
