D/USDT -ignition candle D/USDT is quietly building a strong bullish structure that’s hard to ignore. The chart shows a clear sequence of Higher Highs (HH) and Higher Lows (HL), suggesting growing buyer strength and accumulation.
What stands out is the slow, methodical price action — a classic prelude to a "God candle" ign
Related pairs

DUSDT Forming Falling WedgeDUSDT is displaying a well-defined falling wedge pattern, which typically signals a strong bullish reversal once a breakout occurs. The structure of this chart suggests that selling momentum is waning while accumulation is gradually increasing. A breakout above the upper resistance of the wedge can

DUSDT | Blue Boxes May Offer a Short-Term OpportunityWhile I have no intention of holding DUSDT for the long term, the recent structure suggests that there could be a second wave of upside potential. The blue boxes on the chart represent areas where buyers have previously stepped in, and they may serve as useful entry zones for short-term positioning.

$D / USDT PredictionHello traders,
On the daily chart, we can see a strong breakout accompanied by significant volume and a successful retest. I’ve highlighted a few key inflection points on the chart. Overall, the outlook appears very bullish, and it seems capable of withstanding Bitcoin's sudden price move

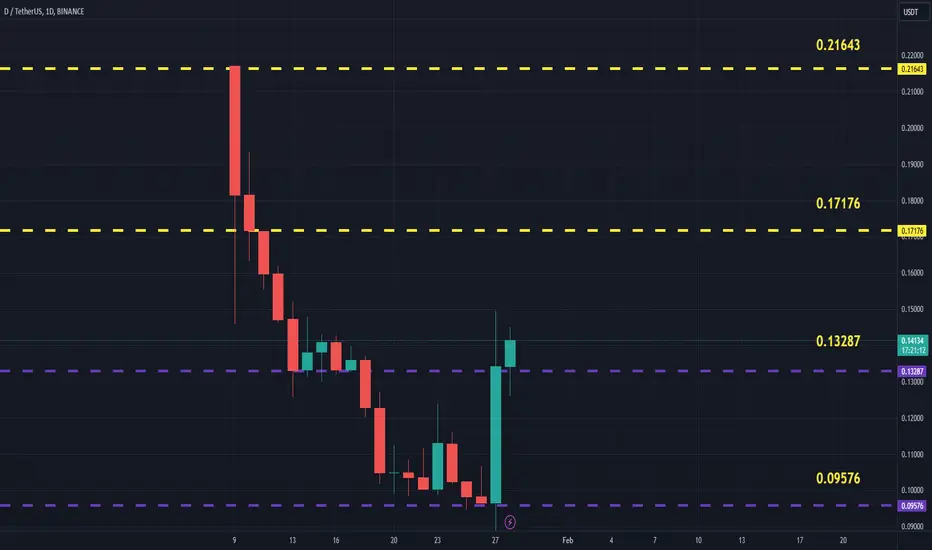
DUSDT Updated till 28-01-25DUSDT Daily timeframe range. PA is fairly new here. it found a new support at 0.09576. below that is price discovery. this kind of price action got lots of opportunity for scalp and swing trades. for further move it needs confirm close above 0.13287.
D/USDTKey Level Zone: 0.12400 - 0.12800
HMT v5 detected. The setup looks promising, supported by a previous upward/downward trend with increasing volume and momentum, presenting an excellent reward-to-risk opportunity.
HMT (High Momentum Trending):
HMT is based on trend, momentum, volume, and market str

See all ideas
Summarizing what the indicators are suggesting.
Oscillators
Neutral
SellBuy
Strong sellStrong buy
Strong sellSellNeutralBuyStrong buy
Oscillators
Neutral
SellBuy
Strong sellStrong buy
Strong sellSellNeutralBuyStrong buy
Summary
Neutral
SellBuy
Strong sellStrong buy
Strong sellSellNeutralBuyStrong buy
Summary
Neutral
SellBuy
Strong sellStrong buy
Strong sellSellNeutralBuyStrong buy
Summary
Neutral
SellBuy
Strong sellStrong buy
Strong sellSellNeutralBuyStrong buy
Moving Averages
Neutral
SellBuy
Strong sellStrong buy
Strong sellSellNeutralBuyStrong buy
Moving Averages
Neutral
SellBuy
Strong sellStrong buy
Strong sellSellNeutralBuyStrong buy
Frequently Asked Questions
The current price of D / TetherUS (D) is 0.03364 USDT — it has risen 4.22% in the past 24 hours. Try placing this info into the context by checking out what coins are also gaining and losing at the moment and seeing D price chart.
D / TetherUS price has risen by 16.12% over the last week, its month performance shows a 2.13% increase, and as for the last year, D / TetherUS has decreased by −84.50%. See more dynamics on D price chart.
Keep track of coins' changes with our Crypto Coins Heatmap.
Keep track of coins' changes with our Crypto Coins Heatmap.
D / TetherUS (D) reached its highest price on Jan 9, 2025 — it amounted to 0.21707 USDT. Find more insights on the D price chart.
See the list of crypto gainers and choose what best fits your strategy.
See the list of crypto gainers and choose what best fits your strategy.
D / TetherUS (D) reached the lowest price of 0.02612 USDT on Jun 22, 2025. View more D / TetherUS dynamics on the price chart.
See the list of crypto losers to find unexpected opportunities.
See the list of crypto losers to find unexpected opportunities.
The safest choice when buying D is to go to a well-known crypto exchange. Some of the popular names are Binance, Coinbase, Kraken. But you'll have to find a reliable broker and create an account first. You can trade D right from TradingView charts — just choose a broker and connect to your account.
D / TetherUS (D) is just as reliable as any other crypto asset — this corner of the world market is highly volatile. Today, for instance, D / TetherUS is estimated as 2.94% volatile. The only thing it means is that you must prepare and examine all available information before making a decision. And if you're not sure about D / TetherUS, you can find more inspiration in our curated watchlists.
You can discuss D / TetherUS (D) with other users in our public chats, Minds or in the comments to Ideas.