DUSKUSDT 3DDouble Bottom formation on #DUSK 3-days chart. It is trying to breakout the Resistance Zone. I'm expecting bullish move. Targets are:
$0.3657 $0.3942 $0.4968 and $0.5403
Long-terms targets:
$0.9361 and $1.0315
DUSKUSDT.PS trade ideas

DUSKUSDT.PDUSKUSDT.P IS ib bullish trend .
bearish divergence also form.
we wait and watch for trend reversal if trend breaks the last HL then it will move downward and seller wiil be active.

DUSK 0.31 a cool real world investment they say around $15Trillion is going to come into RWA play
this should be one of those that shall benefit considering it's way under valued and playing catch up
besides my fibonacci and bollinger guide me to stay calm

DUSK/USDT Could DUSK Break out the resistance or rejected ??💎DUSK has undoubtedly garnered significant attention in the market. Presently, DUSK finds itself in a critical position, facing the daily resistance area, which coincides with the neckline of an ADAM & EVE pattern.
💎 If DUSK manages to break out of this resistance, it could serve as a bullish signal for the market, probability leading to a significant upward movement with the chance to reach our target Bearish OB area.
💎 However, if DUSK fails to break through the daily resistance, the price may face rejection and begin a downward trajectory towards the demand area, where it could establish new momentum.
💎 When returning to the demand area, it becomes crucial for the price to bounce. Failure to do so, and a breakdown below the demand, could indicate a reversal to a downward movement, possibly reaching the support level or even going further down.

#DUSK 650 days of accumulation #DUSK 650 days of accumulation
break the resistance and teleport to $1

#DUSK/USDT | LONG#DUSK
The price is moving in a descending triangle on a 1-hour frame
The triangle is expected to be breached upward as long as we do not break the support marked in green
From which the price rebounded more than once
We also have a reversal candle on the hourly frame
Supported by oversold on the MACD indicator
Entry price is 0.2645
First target 0.2675
Second target 0.2675
Third goal 0.2689
Fourth goal 0.2813

DUSK longif dusk gives a pullback at 0.1444 wick, it could be interesting to get in a buy/long
instruction on chart
nfa dyor
educational purpose only


DUSKUSDT.P Short PositionThe price of DUSK/USDT is expected to decrease following the formation of a Double Top pattern.

DUSKUSDT.P Has a potential double top patternThere is a potential double top pattern forming on DUSKUSDT, indicating a possible downward movement in the future. However, it's important to note that predicting market movements involves uncertainty, and relying solely on technical patterns may not guarantee accurate forecasts. Traders should conduct thorough research, consider various factors, and exercise caution when making financial decisions.

#DUSKUSDT LONG impulse movement with liquidity captureLONG #DUSKUSDT from $0.22741
1D TF. The instrument formed a strong local resistance level with several clear touches, behind which unrealized liquidity accumulated for a long time. There is also an active compression within the local trend at the moment, which indicates the interest and strength of buyers.
I expect to see a traded movement near the level, the appearance of active purchases in the glass and an impulse movement with the capture of liquidity.

DUSK/USDT Assessment of the Bull Rally? 👀🚀 DUSK Analysis 💎Paradisers, don’t miss the opportunity to trade #DUSKUSDT, as it’s ready to explode from a crucial demand level.
💎#DuskNetwork is trending up, signaling a possible bullish move from its current demand zone. We expect a retest of the demand level at $0.173, followed by a strong supply zone. If #DUSK stays above this level, it could soar to the major supply zone at $0.275.
💎If #DUSK fails to hold above the support level, we may need to change our strategy. Then, we could look for a bullish entry from a lower bullish Order Block (OB). Be alert, as dropping below this level could trigger a big downtrend.
💎Keep your eyes peeled and be flexible, Paradisers. Your ParadiseTeam is here to provide you with the latest insights and tips, helping you master these market shifts.

$DUSKjust got some
breakout on HTF should see some more movement
is this a rwa project and when did it become one??

DUST USDT LONG SWING| DUSKUSDT | LONG @ 0.14 - 0.17 | TP @ 0.18, 0.19, 0.2, 0.21, 0.22 | SL @ 0.1 | PATTERN = DESCENDING TRIANGLE BREAKOUT | BINANCE |
Swing trade idea. Kindly follow targets and stop loss. Will update with new targets once all 5 are achieved. Mostly trading with PNF charts, MACD, RSI, Stoch, BPI, Cipher, MA/EMA, Support/Resistance on hourly timeframes and higher time frames.
BINANCE:DUSKUSDT BINANCE:DUSKUSDT.P BYBIT:DUSKUSDT.P MEXC:DUSKUSDT.P BITGET:DUSKUSDT.P GATEIO:DUSKUSDT

DUSK/USDT If Bitcoin Stay, Possible Dusk will be continue upward💎 DUSK has undeniably captured significant attention in the market. Currently, DUSK is in the retesting phase at the demand area, which was previously the supply area. The daily candle close reveals a bullish hammer rejection candle at the demand zone, indicating a potential bounce from this level and a probability continuation of the upward movement toward our target area.
💎 The unfavorable scenario is confirmed if, during the retesting phase at the demand area, DUSK fails to maintain its position and undergoes a breakdown. In such a case, DUSK may retreat to the next lower demand area, requiring a bounce and reclamation of the demand level before deciding on further upward or downward movement toward a strong support area.

Dusk SpotBuying this here for spot position.
DCA 0.173-0.18
Stopping if doesn't look good.
Weekly monthly yearly closed last night which is a nice Buliish close if we look into it.
Targeting 0.24 and 0.3.
Note: Not a Financial Advice.

CRYPTO : DUSKUSDTHM signal (High momentum) spotted. Looking good with previous wave up with increasing volume and momentum.
- Price has show upward momentum after consolidation
- support at Zone @ 0.2002 - 0.2021
It is potentially trending up higher with increase of strength and momentum.

DUSK bullish OBDUSK looking good and ready to fly higher but we need to be patient and not to rush into trade.....Wait for DUSK to mitigated the bullish OB and long from there.......
Follow for more market update and trade setup

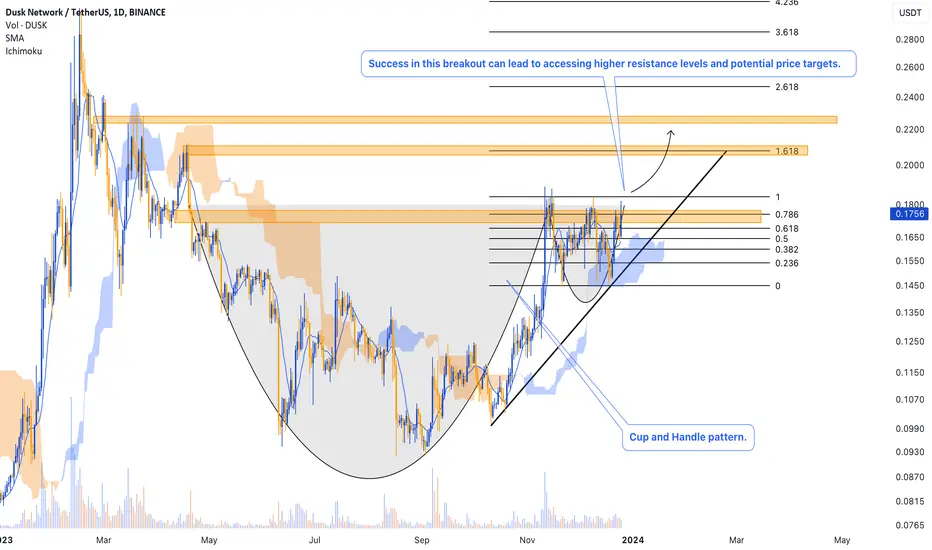
Cup and Handle PatternIn the daily chart of DUSK, we have identified the presence of a Cup and Handle pattern.
Should the price convincingly breach and establish itself above the critical Fibonacci retracement level of 0.786, it will unlock access to higher resistance levels, thereby setting the stage for potential future price targets.
This analysis is for guidance only and shouldn't be taken as direct trading advice.
DUSK/USDT$DUSK accumulation mode, lagging compared to most altcoins that have broken out of accumulation mode, showing sign of strength with the bull flag pattern here, I have measured the potential target, lets get it!

📈DUSK/USDT Long ➡️Entry Price: 0.16500
1: 0.16950
2: 0.17450
3: 0.18500
⛔️Stop-Loss: 0.159800
25 X
BINANCE:DUSKUSDT.P BINANCE:DUSKUSDT.P

DUSKUSDTshort trade idea, point of interest taken after price takes out inducement (MARKED AS XXX)..
supply and demand trading (in line with market structure)
