DUSKUSDT trade ideas

DUSK good potentialThis is not a financial advice. Always do your own research and always put stoploss in your trade (SL) :) If you want more detailed info how to study and read charts or just need help with some coin, just write to me here personal message, i will try to answer to everybody... i can help you :) all for free, don't worry, BE HAPPY!
If u like the analysis, please feel free to ask any question about this TA or crypto or any coin and also leave a comment or like or share the idea, i really appreciate it because then my work makes sense :) thanks!

DUSKYOUR LIKE OR COMMENT IS MY FUEL FOR NEXT ANALYSIS :)
This is not a financial advice. Always do your own research and always put stoploss in your trade (SL) :) If you want more detailed info how to study and read charts or just need help with some coin, just write to me here a comment, i will try to answer to everybody... i can help you :) all for free, don't worry, BE HAPPY!
If u like the analysis, please feel free to ask any question about this TA or crypto or any coin - leave a comment or like or share the idea, i really appreciate it because then my work makes sense :) thanks!

DUSK - great potential mid termThis is not a financial advice. Always do your own research and always put stoploss in your trade (SL) :) If you want more detailed info how to study and read charts or just need help with some coin, just write to me here a comment, i will try to answer to everybody... i can help you :) all for free, don't worry, BE HAPPY!
If u like the analysis, please feel free to ask any question about this TA or crypto or any coin and also leave a comment or like or share the idea, i really appreciate it because then my work makes sense :) thanks!


Duskusdt updateIt is an update about dusk
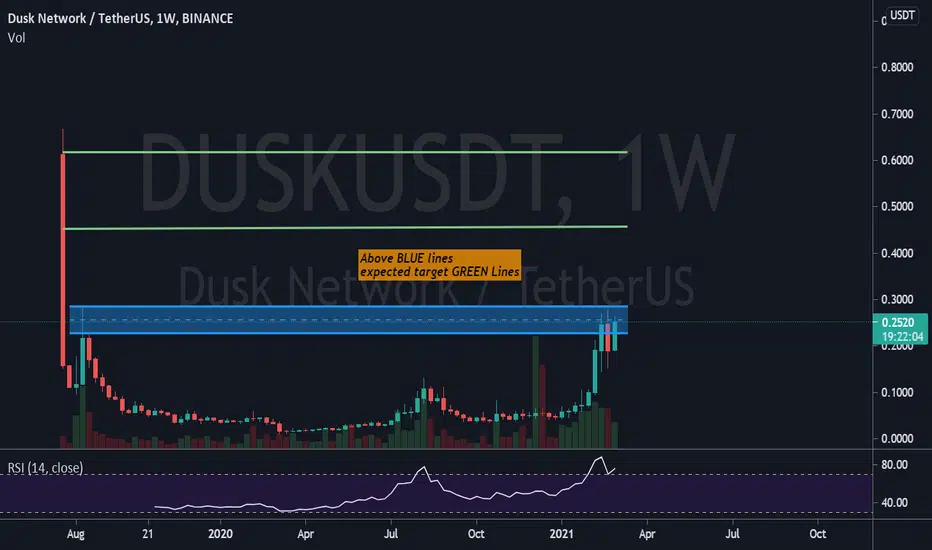
We are goin to hit historical price and record a new ATH
We had 600% profit till now and if break its channel up ward we can see this target 0.5$ after 0.7 folllow by 1$
And after a correction to higher price
Dusk has a great privecy and stronge blockchain that in future you will see how it will be usefull
Do your own research set stop loss


Dusk broke out - some targets to watchDusk - a solid project, finally broke out - bullish environment + great news: updated roadmap and collaboration with Elrond.
$DUSK $ELROND $BINANCE


DUSKUSDT 1 week Typical butterfly/W/harmonic pattern, whatever you want to call it.
Expect this to push to previous ATH around 1.3. After that I wouldn't be sure.

dusk/usdt analysisIf the daily candle does not close below the red line, I expect it to explode in price

Dusk Cup and Handlethe longest night before the dusk. Formed a cup and handle. Attempting breakout. I expect a pullback from the current pump.


dusk/usdta great big win chance really big
dusk was in accumullation pattern for like weeks and weeks finally the turtle head is out
you need tojoin be fore its too late dusk gonna be big

DUSK is wonderful but not for beginnersTry not to buy in green candles please.
this coin's opportunity to buy is to get profit from weekly and monthly chart

DUSKUSDT 0.07$ Soon?$DUSK.X had a nice breakout from weekly resistance and 4h resistance. Now the price is testing the last resistance before 0.07$, According to Plancton's strategy (check our Academy), we can set a nice order
–––––
Follow the Shrimp 🦐
Keep in mind.
🟣 Purple structure -> Monthly structure.
🔴 Red structure -> Weekly structure.
🔵 Blue structure -> Daily structure.
🟡 Yellow structure -> 4h structure.
⚫️ Black structure -> <4h structure.
Here is the Plancton0618 technical analysis, please comment below if you have any question.
The ENTRY in the market will be taken only if the condition of the Plancton0618 strategy will trigger.


Dusk Price at Trendline supportprice at trend line support
bounce from here is a good buy
breaking below will send price lower
