DUSK Rythm Price Cycleon high timeframe like 1D especially in DUSK we see same rythm or pattern with last bull market
Accumulation 1 -> accumulation 2 -> pump (manipulation) -> reaccumulation -> distribution (?)
DUSKUSDT trade ideas

Unlocking DUSKUSDT: The Data That Tells the Real Story - Dusk...◳◱ On the BINANCE:DUSKUSDT chart, the Trendline Touch pattern suggests an upcoming trend shift. Traders might observe resistance around 0.3231 | 0.3765 | 0.4805 and support near 0.2191 | 0.1685 | 0.0645. Entering trades at 0.198 could be strategic, aiming for the next resistance level.
◰◲ General Information :
▣ Name: Dusk Network
▣ Rank: 539
▣ Exchanges: Binance, Kucoin, Huobipro, Gateio, Mexc, Hitbtc
▣ Category / Sector: Infrastructure - Smart Contract Platforms
▣ Overview: Dusk Network is a blockchain protocol designed to support the development and deployment of security tokens.
◰◲ Technical Metrics :
▣ Current Price: 0.198 ₮
▣ 24H Volume: 2,315,408.090 ₮
▣ 24H Change: -2.511%
▣ Weekly Change: -25.51%%
▣ Monthly Change: 5.26%%
▣ Quarterly Change: -10.18%%
◲◰ Pivot Points :
▣ Resistance Level: 0.3231 | 0.3765 | 0.4805
▣ Support Level: 0.2191 | 0.1685 | 0.0645
◱◳ Indicator Recommendations :
▣ Oscillators: NEUTRAL
▣ Moving Averages: STRONG_SELL
◰◲ Summary of Technical Indicators : SELL
◲◰ Sharpe Ratios :
▣ Last 30 Days: 1.92
▣ Last 90 Days: 0.01
▣ Last Year: 0.68
▣ Last 3 Years: 0.24
◲◰ Volatility Analysis :
▣ Last 30 Days: 1.30
▣ Last 90 Days: 1.09
▣ Last Year: 1.15
▣ Last 3 Years: 1.18
◳◰ Market Sentiment :
▣ News Sentiment: N/A
▣ Twitter Sentiment: N/A
▣ Reddit Sentiment: N/A
▣ In-depth BINANCE:DUSKUSDT analysis available at TradingView TA Page
▣ Your thoughts matter! What do you think of this analysis? Share your insights in the comments below. Your like, follow, and support are greatly valued and help sustain high-quality content.
◲ Disclaimer : Disclaimer
The content provided is for informational purposes only and does not constitute financial, investment, or trading advice. Always conduct your own research and consult a qualified professional before making any financial decisions. Use of the information is solely at your own risk.
▣ Explore the Power of Charting with TradingView
Unlock a wide range of financial analysis tools, data, and features to elevate your trading experience. Take a tour and see the possibilities. If you decide to upgrade your plan, you can receive up to $30 back. Discover more here - affiliate link -

Dusk Spot LoadedLoading a lot of Dusk in spot for Massive move.
Targeting 1 and 2 and can be more higher.
If correct on idea it should move sooner and be in the first one's to create new highs.
Note: Not a Financial Advise.

#DUSK (SPOT) IN (.295- .320) T. (.630) SL(.290)BINANCE:DUSKUSDT
#DUSK / USDT
Entry (.295- .320)
SL 4H close below .290
T1 .36
T2 .39
T3 .42
T4 .48
T5 .57
T5 .63
______________________________________________________________
Golden Advices.
********************
* collect the coin slowly in the entry range.
* Please calculate your losses before the entry.
* Do not enter any trade you find it not suitable for you.
* No FOMO - No Rush , it is a long journey.
Useful Tags.
****************
My total posts
www.tradingview.com
1Million Journey
www.tradingview.com
www.tradingview.com
**********************************************************************************************
#Manta #OMNI #DYM #AI #IO #XAI #ACE #NFP #RAD #WLD #ORDI #BLUR #SUI #VOXEL #AEVO #VITE #APE #RDNT #FLUX #NMR #VANRY #TRB #HBAR #DGB #XEC #ERN #ALT #IO #ACA #HIVE #ASTR #ARDR #PIXEL #LTO #AERGO #SCRT #ATA #HOOK #FLOW #KSM #HFT #MINA #DATA #SC #JOE #RDNT #IQ #CFX #BICO #CTSI #KMD #FXS #DEGO #FORTH #AST #PORTAL #CYBER #RIF #ENJ #ZIL #APT #GALA #STEEM #ONE #LINK #NTRN #COTI #RENDER #ICX #IMX #ALICE #PYR #PORTAL #GRT #GMT #IDEX #NEAR #ICP #ETH #QTUM #VET #QNT #API3 #BURGER #MOVR #SKL #BAND #ETHFI #SAND #IOTX #T #GTC #PDA #GMX #REZ #DUSK

DUSK USDTGonna bet myself on the market this time. It looks too good to be true but if the crypto market cycle this time still flowing to coins with small market cap. This chart setup looks possible! The best ever scenario allows DUSK to push 10X target.
DUSK itself is RWA and Privacy narrative coin with only $100M market cap. Social media attention still active until today. A very good setup from here. Let's see

Alikze »» DUSK | Bullish Wave 3 or C Scenario - 1W🔍 Technical analysis: Scenario of wave 3 or C in the ascending channel
📣 BINANCE:DUSKUSDT is moving in an ascending channel on the weekly time frame.
🟢 In the previous rally, it stopped at the supply range of 55 cents and a corrective cycle was formed to the origin of the movement of 14 cents.
🟢 Currently, it is facing demand, considering the first movement wave and the correction to the origin of the previous movement.
💎 This movement wave is the third wave, which is located in the microwaves 3 of the first 3 waves, considering the current momentum.
💎 Therefore, in the first step: this movement cycle will have the ability to grow to the first supply zone.
⚠️ In addition, if the price correction enters the range of this validation level, the bullish scenario will be invalidated and must be re-examined and updated.⚠️
»»»«««»»»«««»»»«««
Please support this idea 💡 with a LIKE 👍 and COMMENT 💬 if you find it useful and Click "Follow" on our profile if you'd like these trade ideas delivered straight to your email 📧 in the future.
Thanks for your continued support.🙏
Best Regards,❤️
Alikze.
»»»«««»»»«««»»»«««

dusk on the roadDusk W and daily time frame...
it broken the trend line and now is on daily resistance we are in from 0.195
full target is 0.55 if 0.29 broken and fix top it we have new entry to 0.55 target
in this region i expect a range move or even a drop for hunt liquidity ...
be aware of FOMO
our entry was on 0.195 and we had a grow so control your emotions and wait for a good situation...
also heavy entry can save profit for 30% and if you can accept the risk save profit 15% can be acceptable.
this is not signal for buy or sell orders please search yourself bless you guys.

DUSK buy setup (1D)The price structure in hourly time frames is bearish.
There are good liquidity pools at the bottom of the chart.
The pullback in substructure is expected to complete and sweep liquidity pools.
The green range is where we expect a rebuy.
Closing a daily candle below the invalidation level will violate this analysis
invalidation level : 0.1018
For risk management, please don't forget stop loss and capital management
Comment if you have any questions
Thank You

Dusk redy to gohey goys i see Dusk redy to go , let hum goo
just not forget follow me to get more news

Trade Signal: DUSKUSDT - SellWe have identified a short opportunity for the DUSKUSDT trading pair using our EASY Quantum Ai strategy. Below are the trade specifics and rationale:
Direction: Sell
Enter Price: 0.2448
Take Profit: 0.2331
Stop Loss: 0.2526
Our analysis points towards a bearish movement due to several factors:
1. Technical Indicators: Recent analysis shows a predominance of bearish candlestick patterns, suggesting downward momentum. The Relative Strength Index (RSI) indicates an overbought condition, providing potential for reversal.
2. Market Sentiment: Current market news and sentiment around DUSK indicate a possible decrease in buying pressure. External macroeconomic factors, such as recent announcements from regulatory bodies, also contribute to a more cautious outlook.
3. Volume Analysis: There has been a notable decrease in buying volume, which may not sustain higher price levels. This decreasing volume typically correlates with upcoming price declines.
Please ensure to monitor market conditions closely, as unforeseen news events might impact this forecast. Trade responsibly and adjust your strategy accordingly.

DUSK Further DownsideAfter breaking and retesting the gray support level, price is in a strong downtrend which doesn't seem to be over.
There is no RSI divergence, a higher high or clear bullish price action to justify long trades.
Therefore my expectation is that the downtrend will continue, initially targeting recent low (at 0.1448) and the 100% AB extension (at 0.1106)

Dusk Network Long-Term Growth (1,300% New 2025 All-Time High)Dusk Network has been growing long-term, since 2020. We can see how the last bull-market developed in a total of three major waves. We have a similar scenario in this cycle.
The waves look small here because we are using the logarithmic scale or else nothing would fit on the chart but, if you were to look at the linear chart you can better appreciate where we are at exactly, the last wave is the biggest and for us this means the 2025 bull-market.
We have the higher highs and higher lows sequence, all pretty standard, the bottom was hit December 2022, same as the pair we just visited (ANKRUSDT). So we can expect a major higher high in 2025 and that would be equal to a new All-Time High.
The main two targets for this new ATH are the following:
➢ 1) $1.85 for a total of 772%.
➢ 2) $2.95 for a total of 1,300% growth potential.
These are the standard targets based on past history. While everything is cyclical and so far we always get the same, this doesn't necessarily mean that it will always stay this way. The market can surprise and grow more than expected. It is unlikely that it will underperform. We get at least the first of the two targets and that would be extremely easy for Crypto. And thus we aim high up.
2025 will be a year of massive growth.
We don't know how the market will be affected when Cryptocurrency becomes mainstream and people start to use the Altcoins to pay for everyday stuff, in-person.
Thanks a lot for your continued support.
Namaste.

Bottom formed, duskMainnet for dusk incoming. Expecting sharp breakout after good bottom structure formed.

Dusk Possible LongTimeframe 4 Hour.
High RR Long if Dusk holds here for a while and rejects.
Entering long from here under 0.19700
Invalidation Clean breaking below current level.
If holds expecting a good move from here.
Note: Not a Financial Advise.

Premium Long Trade Setup: DUSKUSDTToday, I’m excited to share our premium long trade setup for DUSKUSDT. Let’s start by focusing on the critical $1.45 support level, where we observed a clean rejection of the 161.8% Fibonacci support. This rejection is a strong positive signal, indicating a potential trend reversal for DUSK.
Currently, we see the completion of a 5-wave move to the upside, which confirms that this rally is not merely an ABC correction. With the 5-wave structure complete, it’s logical to anticipate an ABC correction to the downside.
We’ve strategically placed our buy limit order at $0.2211, offering a robust 1:3 risk-reward opportunity. Additionally, we’ve set three upside targets. Upon reaching the first target, we plan to secure 50% of the profit and simultaneously eliminate the trade’s risk. This approach allows us to manage the trade with confidence, knowing that we’re in a strong position for potential gains.
Let’s monitor this setup together and enjoy the process. Happy trading!

WoA Dusk...FBuy, Buy and NOw Sell print. That was very special from Dusk. We are shorting
For indicator access: text me

DUSKUSDT.1DThe daily chart for DUSK/USDT (Dusk Network paired with US Dollar Tether) presents several crucial technical aspects, which I'll analyze in detail:
Trend Analysis
The overall trend has been bearish, with DUSK/USDT experiencing a significant downward trajectory since June. However, recent price action suggests a potential reversal as the price has risen above the descending trendline S1, indicating a possible shift in momentum.
Support and Resistance Levels
R1 ($0.2053): This level represents immediate resistance. It has recently been approached, indicating a potential struggle or breakout point.
R2 ($0.2459): This is the next significant resistance level. A break above R1 could lead to a test of R2, which aligns with earlier price points that acted as resistance in May and June.
S1 ($0.1673): Currently acts as support after the price moved above it. It's crucial to monitor if the price retraces, as a fall below could signal a continuation of the bearish trend.
Technical Indicators
MACD: The Moving Average Convergence Divergence shows a bullish crossover, with the histogram indicating growing bullish momentum. This is a positive sign that supports the potential for further upward movement.
RSI: The Relative Strength Index is around 40.63, suggesting that there is still room for upward movement before the asset becomes overbought.
Current Market Position
The current price of DUSK/USDT is $0.2029, just below the R1 resistance level. This positioning is crucial as it tests the resolve of the recent bullish push.
Trading Strategy
Given the break above the trendline S1 and the bullish signals from the MACD and RSI, my current strategy would be cautiously optimistic. I would consider entering a long position if there's a daily close above R1, targeting R2 while keeping a tight stop-loss just below the S1 support level to manage risks.
Conclusion
In conclusion, DUSK/USDT shows signs of a potential reversal from its previous bearish trend. Monitoring how it behaves near the R1 level will be key to confirming if the bullish sentiment has enough strength. This setup warrants a dynamic trading strategy that can adapt to changes as they occur, especially if new highs are made or if the price fails to sustain above S1.

Trade Setup: DUSK Long PositionMarket Context:
$DUSK is potentially forming a double bottom in a high-conviction zone, suggesting a possible bounce. A break above $0.20, followed by a retrace to support, could signal a continuation of bullish momentum.
Trade Setup:
Entry: Around $0.19 - $0.20.
Take Profit:
First target: $0.283
Second target: $0.35
Third target: $0.4083
Stop Loss: Daily close below $0.16.
📊 Look for confirmation of a higher high and reclaim of support for bullish momentum. #DUSK #CryptoTrading #TechnicalAnalysis 🎯

papicoin long term strategy for dusk $duskblessings to all sisters and brothers who search and work for consciousness, love and freedom.
for you who understand what is going on and see on crypto the opportunity to empower decentralized communities for decentralized power and wealth, i am glad to share my long term strategy on theses cryptos that I am willing to accumulate and hodl.
the green areas are the ones I will use to but and accumulate, the lower the prices the more amount of capital, of course.
in the blue areas I will be taking some profits, the higher the price the more I will distribute.
feel free to ask anything, i would be glad to answer, but I do not promise immediate responses, lol.
keep connecting to the vibrations and elevating the frecuencies for the human awakening by meditating, praying, celebrating and being the origin of love and harmony!

Dusk / Usdt $Dusk
✨Entry : 0.1740 - CMP
🎯Targets : 0.1906 - 0.2043 - 0.2130..+
🎯0.28 Possible In Midterm
❌SL : 10%

DUSK ANALYSISBelow the price is the liquidity pool. The pool is expected to be swept soon.
We have a bearish CH on the chart, which indicates an internal pullback.
It is expected that we will move from the supply side to the demand side.
Closing a daily candle above the invalidtion level will violate the analysis
Note that the financial market is risky, so:
Do not enter any position without confirmation and trigger.
Do not enter a position without setting a stop.
Do not enter a position without capital management.
When we reach the first TP, save some profit and try to move the stop continuously in the direction of your profit.
If you have any comments please post them, comments will help us improve our performance
Thanks


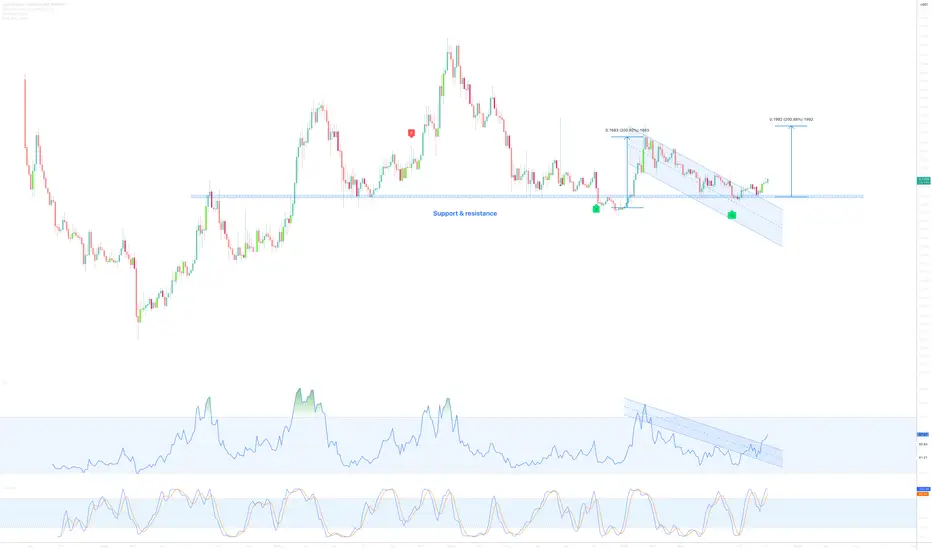
Dusk Network - 200% waiting to be collectedOn the above 4-day chart price action has corrected 70% since the year began. A number of reasons now exist to be long, including:
1) Price action and RSI resistance breakouts.
2) Regular bullish divergence. All but one oscillator continues to print positive divergence with price action.
3) Look left. Price action confirms support on past resistance.
4) Bull flag breakout. Flagpole measures 200% from breakout.
5) GRM support confirmed.
Is it possible price action corrects further? Sure.
Is it probable? No and no.
Ww
Type: trade
Risk: <=6%
Timeframe for long: Now
Return: 200%