#DYDX/USDT Ready to launch upwards#DYDX
The price is moving in a descending channel on the 1-hour frame and sticking to it well
We have a bounce from the lower limit of the descending channel, this support is at a price of 1.37
We have a downtrend on the RSI indicator that is about to be broken, which supports the rise
We have a trend to stabilize above the moving average 100
Entry price 1.46
First target 1.57
Second target 1.72
Third target 1.89
DYDXUSDT.P trade ideas

DYDXUSDT.1DThe daily chart of DYDX/USDT shows a robust upward trend followed by a recent correction. This analysis will explore the key price levels, assess the strength of the current trend, and interpret the implications of technical indicators for future price movements.
Price Action and Structure:
DYDX/USDT experienced a significant surge, pushing the price to challenge the resistance at $2.4697 (R1). After reaching this peak, the price faced a sharp pullback, now hovering around $2.1065. This correction could be a healthy retracement in an ongoing bullish market.
Resistance and Support Levels:
Resistance Levels: Immediate resistance is located at $2.4697 (R1). Overcoming this could open the path toward the next major resistance at $3.2969 (R2). The recent high provides a psychological ceiling that, if broken, may encourage further bullish momentum.
Support Levels: The nearest significant support lies at $1.3724 (S1). This level could act as a pivotal zone for the price to stabilize and potentially rebound. Further down, $0.7984 (S2) serves as a stronger historical support level, which might come into play if a more extensive sell-off occurs.
Moving Averages:
Not explicitly shown on the chart, but typically, the placement of the price relative to key moving averages like the 50-day or 200-day can indicate the trend's strength and potential reversal points.
Technical Indicators:
MACD: The Moving Average Convergence Divergence (MACD) is currently in a bearish crossover, as the MACD line is below the signal line, suggesting that the downward momentum is increasing.
RSI: The Relative Strength Index (RSI) is at 66.29, which is slightly above the neutral 50 mark but well below the overbought threshold of 70. This indicates that there might still be room for upward movement without the asset being overextended.
Conclusion:
DYDX/USDT's recent price action suggests a correction phase within a broader bullish trend. The key levels to watch are the support at $1.3724 (S1) and the resistance at $2.4697 (R1). The technical indicators, including a bearish MACD and a moderately high RSI, suggest that while the momentum is slowing, the overall market sentiment may still support recovery back towards higher resistance levels. Investors should monitor these indicators and price levels closely to gauge the potential for continuation of the uptrend or a deeper pullback.

dydx - consolidation1000 days of accumulation, dydx will show itself soon. Potential growth targets noted

Dydx1$ DYDX will be soon in reach. The rest of the chart may not be 100% accurate. But 1$ is the best and the best opportunity to buy. It's recommended for HODLERS. A safe low-risk investment.
A bright future!!!hello friends
We have come with the analysis of another coin
DYDX which is in DEFI area.
This coin has been suffering for a long time and now by making a bottom, it was able to experience an upward movement.
It is expected that it will move at least up to the limit of range and this time it is likely to succeed in breaking the ceiling.
Now, if you have this coin, you can keep it up to the range limit, and after the successful failure of the range, you can proceed to the specified targets with it.
Now, if you want to buy this coin, our suggestion to you is that one entry step is appropriate now and we will wait if the market corrects at the specified points, we will buy other steps.
If you grow from this area, you can buy a step with the successful failure of your TR and wait for good targets...

#DYDX Placing stink bids for the upcoming dump will add more to the position when we start seeing reaction from marked entry
or will add more above it will update here if I do

DYDXUSDT 1WdYdX Update ~ 1W
#dYdX At 1W Time Frame, #dYdX Again, it was rejected from this resistance line. The best way for now. Buy gradually after breaking this resistance line with a Full Candel,. Or you can place a buy on this support block..
these two scenarios with a minimum target of 20%+

DYDX Two Side Trade / Deadpool is angry:-*BINANCE:DYDXUSDT
BITSTAMP:DYDXUSD
👾Note: The setup is active but expect the uncertain phase as well.
Road-Map: If the price stabilizes below the 2.35 level, dydx can reach near 2$ area,
In chart, I set two positions, one is active and it's short and next one is long.
⚡️TP - Short Setup
2.15
1.94
🔴SL:
2.52
⚡️TP - Long Setup
2.07
2.27
🔴SL:
1.69
🧐The Alternate scenario:
If the price stabilizes against the direction of the position, below or above the trigger zone, the setup will be canceled.

Dydx to 6$ long targetDYDX to $6.6 – 🚀 Ready for Takeoff?
DYDX/USDT is showing a strong reversal pattern, and the momentum suggests we’re gearing up for a powerful move upward.
Keep an eye on this move—it’s shaping up to be a textbook breakout! Let’s see if DYDX delivers. 💎🚀

DYDX bullishBINANCE:DYDXUSDT
DYDX has been bearish since 2022, dropping all the way to its recent bottom at $1. Currently, it’s testing a key level at $2.6. This is a key level to watch if DYDX successfully breaks above it with a daily candle close, the next target would be $4.5.

DYDX 4h Bullish signal DYDX in a good place for buy in spot trading . if you wanna trade it futures please manage your risk in low lev and low vol . good luck

KSM today Next is DYDXMaybe it is DYDX's turn. Noticed KSM was up 70% and identified an identical pattern on DYDX on the weekly. They both sprung from half a year of accumulation but DYDX has yet to stand out. Will not want to miss this one.

dYdX: The Downtrend Is Over (400%+ Potential First Wave)Ladies and gentlemen... The signals are very clear and strong here, dYdX is no longer bearish. dYdX's downtrend is now over. It is time to celebrate because we are going full-time, big-time GREEN!
Here we can see mainly three signals:
1) Downtrend. The downtrend line from March 2024 has been broken in September 2024. DYDXUSDT is officially out of bearish territory.
2) All-Time Low. Before breaking this downtrend, dYdX produced a new All-Time Low and rounded bottom. This is a classic reversal signal.
3) Rising volume. We have the highest volume in a very long while. This breakout that is happening now is the real deal as it is supported by really high volume.
From current prices, we can easily see 140% growth in the coming weeks, with much more possible long-term. You can find more details on the chart.
Thank you for reading.
We are going big-GREEN!
The Altcoins market is heating up!
(DYDXBTC can be found in the 'Related publications' below.)
Namaste.

Update of analysis of dydx/usdt Dear traders tp 1cof dydx reached successfully.......mmmmmm
Comming
Omg
$€¥₩₽......fly

DYDXUSDT: The Numbers That Could Redefine the Market - dYdX◳◱ On the DYDXUSDT chart, the Bband Breakout pattern suggests a consolidation phase that could precede a trend continuation or reversal. Traders might observe resistance around 1.8347 | 1.964 | 2.3073 and support near 1.4914 | 1.2774 | 0.9341. Entering trades at 2.2641 could be strategic, aiming for the next resistance level.
◰◲ General Information :
▣ Name: dYdX
▣ Rank: 139
▣ Exchanges: Binance, Kucoin, Huobipro, Gateio, Mexc, Hitbtc
▣ Category / Sector: Financial - Decentralized Exchanges
▣ Overview: dYdX is a decentralized exchange built on the Ethereum network delivering key financial instruments to users such as perpetuals, margin and spot trading, as well as lending and borrowing. dYdX equips traders with off-chain order books with on-chain settlement and enables them to short-sell tokens, increase exposure by longing with leverage, or earn interest on deposited tokens to move quickly. dYdX leverages StarkWare's Layer 2 to eliminate the need to trust a centralized exchange while trading, and thus combines the security and transparency of a decentralized exchange, with the speed and usability of a centralized exchange.
◰◲ Technical Metrics :
▣ Current Price: 2.2641 ₮
▣ 24H Volume: 202,648,824.111 ₮
▣ 24H Change: 21.334%
▣ Weekly Change: 41.87%%
▣ Monthly Change: 123.08%%
▣ Quarterly Change: 159.42%%
◲◰ Pivot Points :
▣ Resistance Level: 1.8347 | 1.964 | 2.3073
▣ Support Level: 1.4914 | 1.2774 | 0.9341
◱◳ Indicator Recommendations :
▣ Oscillators: NEUTRAL
▣ Moving Averages: STRONG_BUY
◰◲ Summary of Technical Indicators : BUY
◲◰ Sharpe Ratios :
▣ Last 30 Days: 7.69
▣ Last 90 Days: 3.14
▣ Last Year: -0.09
▣ Last 3 Years: 0.11
◲◰ Volatility Analysis :
▣ Last 30 Days: 1.25
▣ Last 90 Days: 1.17
▣ Last Year: 0.97
▣ Last 3 Years: 1.14
◳◰ Market Sentiment :
▣ News Sentiment: N/A
▣ Twitter Sentiment: N/A
▣ Reddit Sentiment: N/A
▣ In-depth DYDXUSDT analysis available at TradingView TA Page
▣ Your thoughts matter! What do you think of this analysis? Share your insights in the comments below. Your like, follow, and support are greatly valued and help sustain high-quality content.
◲ Disclaimer : Disclaimer
The content provided is for informational purposes only and does not constitute financial, investment, or trading advice. Always conduct your own research and consult a qualified professional before making any financial decisions. Use of the information is solely at your own risk.
▣ Explore the Power of Charting with TradingView
Unlock a wide range of financial analysis tools, data, and features to elevate your trading experience. Take a tour and see the possibilities. If you decide to upgrade your plan, you can receive up to $30 back. Discover more here - affiliate link -

DYDX Potential Play !DYDX / USDT
DYDX started to show some serious bullish signals
1- Price has returned back to the big accumulation zone again after playing some time in manipulation phase/stoploss phase (red)
2- Downtrend line finally broke-out after 6 months of minor bear market
As long as these signals remain intact I see a big potential for DYDX in the coming bull market
Best of wishes

Dydx zone to buyGlobal targets for Dydx can be still relevant. But locally im waiting this targets
BINANCE:DYDXUSDT
Possible Targets and explanation idea
➡️Long time period accumulation but leave sell side liquidity June 2022
➡️Green block for me will be zone for middle term trade range showed
➡️Fixation trade will be in W fvg
➡️Money Power indicator shows inflow capital in DYDX like it was in 2022
Hope you enjoyed the content I created, You can support with your likes and comments this idea so more people can watch!
✅Disclaimer: Please be aware of the risks involved in trading. This idea was made for educational purposes only not for financial Investment Purposes.
---
• Look at my ideas about interesting altcoins in the related section down below ↓
• For more ideas please hit "Like" and "Follow"!

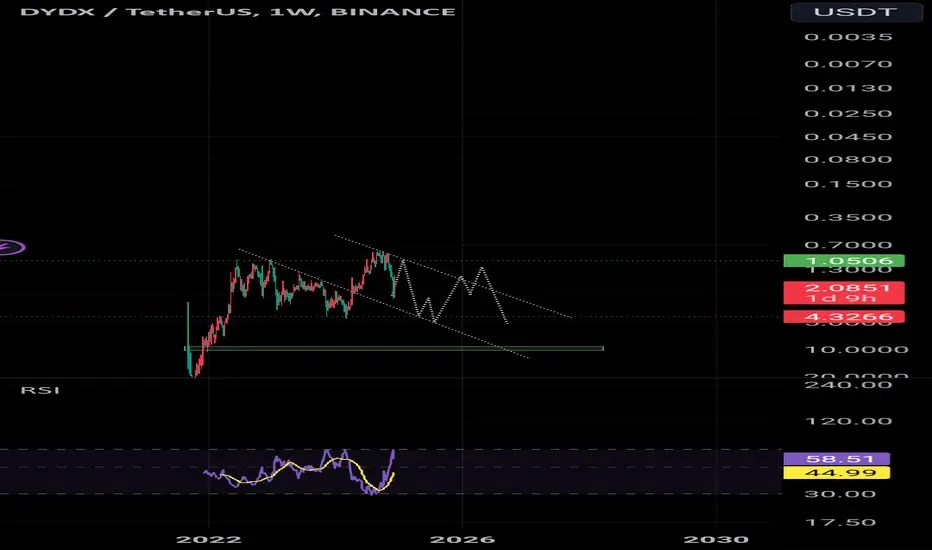
i think one of the biggest pump is coming, is inevitable !!Tell me honestly, who noticed this? Since I’ve been monitoring the chart for a long time, some things only become clear when the moment approaches. My thought is that the trendline is the key to significant profits. Of course, there’s also the W MA100, but that likely isn’t the main issue. Essentially, we’re seeing a confluence of three resistances there: the W MA100, a diagonal, and a long-traded price level at these zones in the past. What do you think about this?

Trading opportunity for DYDXUSDTBased on technical factors there is a Buy position in :
📊 DYDXUSDT
🔵 Buy Now
🪫Stop loss 1.6200
🔋Target 1 1.9500
🔋Target 2 2.1350
🔋Target 3 2.3250
💸RISK : 1%
We hope it is profitable for you ❤️
Please support our activity with your likes👍 and comments📝

$DYDXUSDT will rise 60%hi everyone,
Im here for another banger trade. based on waves, it should gain 60%. I would not miss this nice setup. Dont leave me alone here:)
Pls show your support and hit the support button.
thank you


DYDX is exploding !dydx in daily time frame made a big ABC pattern which push down the price to the lowest now there is a reaction to the anchored vwap and if the price go higher that the new roof it will continue rising and grabbing liquidity !

DYDX 600% Incoming!!!The price action had shifted into bullish side as you can seen on the chart. I am expecting 600% gain from here. Manage your risk accordingly.
Check out my previous idea on DYDX coin:
