DYDX/USDT Poised for a Massive Breakout – Is a Rally Toward $2+?✨ Comprehensive and Engaging Technical Analysis:
DYDX/USDT is entering a highly compelling technical phase, showing signs of a potential trend reversal after breaking out from a prolonged accumulation zone that lasted nearly 5 months. This breakout on the daily timeframe (1D) is a classic early sig
Related pairs
#DYDX/USDT#DYDX
The price is moving within a descending channel on the 1-hour frame, adhering well to it, and is on its way to breaking strongly upwards and retesting it.
We have support from the lower boundary of the descending channel, at 0.640.
We have a downtrend on the RSI indicator that is about to b

dYdX Hyper Bullish Market Conditions, $11.1 Next Target (1,671%)"Once we hit bottom, there is no other place left to go but up." dYdX hit bottom, a new all-time low last month and is turning ultra-hyper bullish this week. The action is already moving above EMA8 and EMA13 while breaking a local downtrend coming off the December 2024 peak price.
We have a full gr

DYDXUSDT UPDATE
Pattern: Falling Channel Breakout
Current Price: \$0.6246
Target Price: \$0.90
Target % Gain: 60.10%
Technical Analysis: DYDX has broken out of a falling channel on the 12H chart, with strong bullish candles and volume confirming the breakout. A successful retest can validate the move towards the

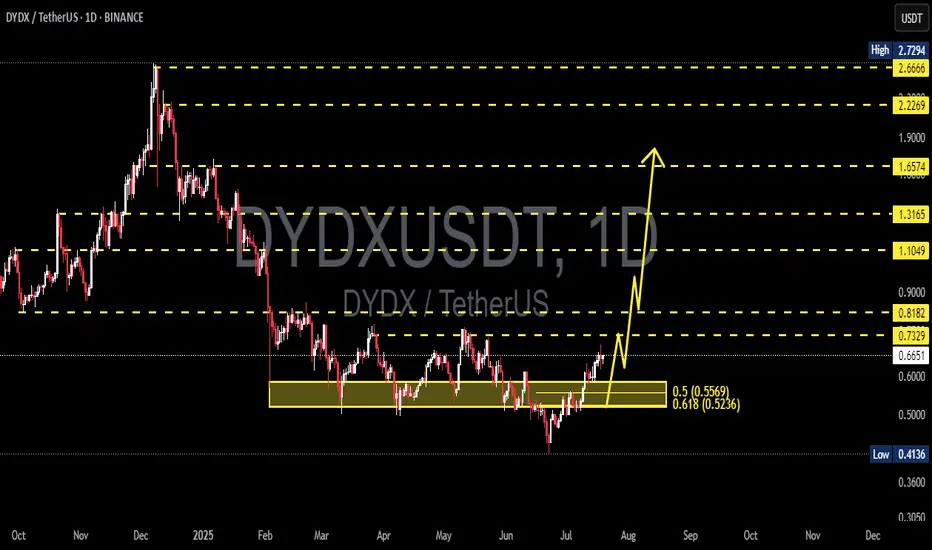
DYDX Breakout from Falling Wedge | Targeting $1.60+# DYDX Breakout from Falling Wedge | Targeting $1.60+
📈 **DYDX/USDT Analysis – Daily Timeframe**
DYDX has just broken out of a falling wedge pattern – a classic bullish reversal formation – after holding a strong support zone around **$0.50**. This zone has acted as a reliable demand area for seve

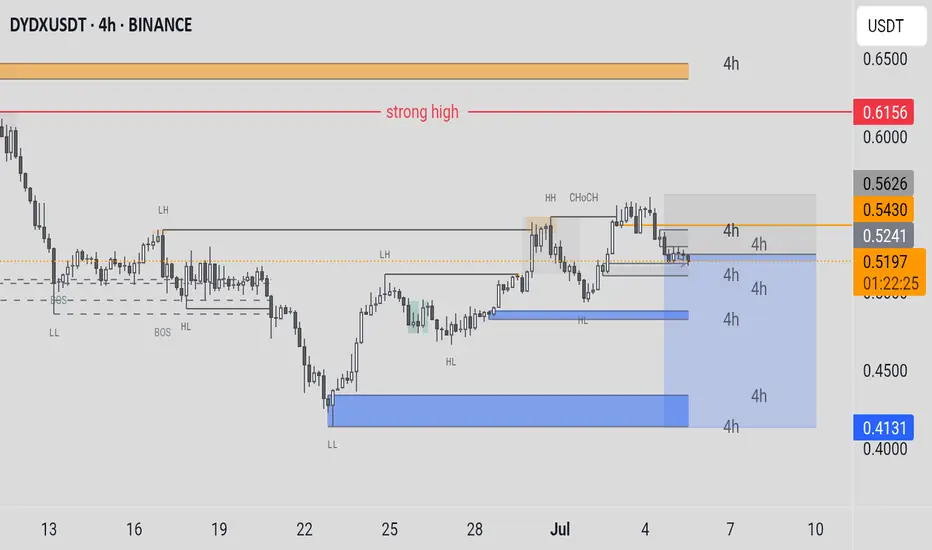
DYDXUSDT Price Levels: The current price is around 0.6030 USDT. The chart highlights a "strong high" resistance level near 0.5626, with higher highs (HH) and change of character (CHOCH) noted recently.Support and Resistance:Support zones are marked around 0.5199, 0.5253, and a lower support (HL) around 0.450
7-star short update -we have received a short signal on DYDX. Short signal on 7-star is finding the top most eligible reversal point. so far so good. Expecting the target
For indicator access, you can contact me
D Y O R
Indicators only tell what happened to the market and should be used with utmost caution but the

#DyDx Superb opportunity#DYDX
The price is moving within a descending channel on the 1-hour frame, adhering well to it, and is on its way to breaking it strongly upwards and retesting it.
We have a bounce from the lower boundary of the descending channel. This support is at 0.470.
We have a downtrend on the RSI indicato

DYDXUSDT 12H#DYDX is moving inside a descending channel on the 12H chart.
In case of a breakout above the channel resistance and the Ichimoku Cloud, the targets are:
🎯 $0.5836
🎯 $0.6237
🎯 $0.6808
🎯 $0.7536
⚠️ As always, use a tight stop-loss and apply proper risk management.

DYDXUSDT Cryptocurrency Futures Market Disclaimer 🚨🚨🚨
Trading cryptocurrency futures involves high risks and is not suitable for all investors.
Cryptocurrency prices are highly volatile, which can lead to significant gains or losses in a short period.
Before engaging in crypto futures trading, consider you
See all ideas
Summarizing what the indicators are suggesting.
Oscillators
Neutral
SellBuy
Strong sellStrong buy
Strong sellSellNeutralBuyStrong buy
Oscillators
Neutral
SellBuy
Strong sellStrong buy
Strong sellSellNeutralBuyStrong buy
Summary
Neutral
SellBuy
Strong sellStrong buy
Strong sellSellNeutralBuyStrong buy
Summary
Neutral
SellBuy
Strong sellStrong buy
Strong sellSellNeutralBuyStrong buy
Summary
Neutral
SellBuy
Strong sellStrong buy
Strong sellSellNeutralBuyStrong buy
Moving Averages
Neutral
SellBuy
Strong sellStrong buy
Strong sellSellNeutralBuyStrong buy
Moving Averages
Neutral
SellBuy
Strong sellStrong buy
Strong sellSellNeutralBuyStrong buy
Displays a symbol's price movements over previous years to identify recurring trends.
Frequently Asked Questions
The current price of dYdX/Tether (DYDX) is 0.6370 USDT — it has fallen −0.41% in the past 24 hours. Try placing this info into the context by checking out what coins are also gaining and losing at the moment and seeing DYDX price chart.
dYdX/Tether price has fallen by −7.75% over the last week, its month performance shows a 22.74% increase, and as for the last year, dYdX/Tether has decreased by −48.17%. See more dynamics on DYDX price chart.
Keep track of coins' changes with our Crypto Coins Heatmap.
Keep track of coins' changes with our Crypto Coins Heatmap.
dYdX/Tether (DYDX) reached its highest price on Sep 8, 2021 — it amounted to 30.0000 USDT. Find more insights on the DYDX price chart.
See the list of crypto gainers and choose what best fits your strategy.
See the list of crypto gainers and choose what best fits your strategy.
dYdX/Tether (DYDX) reached the lowest price of 0.4136 USDT on Jun 22, 2025. View more dYdX/Tether dynamics on the price chart.
See the list of crypto losers to find unexpected opportunities.
See the list of crypto losers to find unexpected opportunities.
The safest choice when buying DYDX is to go to a well-known crypto exchange. Some of the popular names are Binance, Coinbase, Kraken. But you'll have to find a reliable broker and create an account first. You can trade DYDX right from TradingView charts — just choose a broker and connect to your account.
Crypto markets are famous for their volatility, so one should study all the available stats before adding crypto assets to their portfolio. Very often it's technical analysis that comes in handy. We prepared technical ratings for dYdX/Tether (DYDX): today its technical analysis shows the neutral signal, and according to the 1 week rating DYDX shows the sell signal. And you'd better dig deeper and study 1 month rating too — it's sell. Find inspiration in dYdX/Tether trading ideas and keep track of what's moving crypto markets with our crypto news feed.
dYdX/Tether (DYDX) is just as reliable as any other crypto asset — this corner of the world market is highly volatile. Today, for instance, dYdX/Tether is estimated as 1.36% volatile. The only thing it means is that you must prepare and examine all available information before making a decision. And if you're not sure about dYdX/Tether, you can find more inspiration in our curated watchlists.
You can discuss dYdX/Tether (DYDX) with other users in our public chats, Minds or in the comments to Ideas.