dydx long ALL trading ideas have entry point + stop loss + take profit + Risk level.
hello Traders, here is the full analysis for this pair, let me know in the comment section below if you have any questions, the entry will be taken only if all rules of the strategies will be satisfied. I suggest you keep this pair on your watchlist and see if the rules of your strategy are satisfied. Please also refer to the Important Risk Notice linked below.
Disclaimer
DYDXUSDT trade ideas

DYDXUSDT bearish trendTrend line is showing bearish market and its making LL and HL
Fib retracement at 0.382 is the entry point in trade.
Previous HL is at 3.459 which is now stop loss.
TP is set on 1:1 ratio of win/loss.

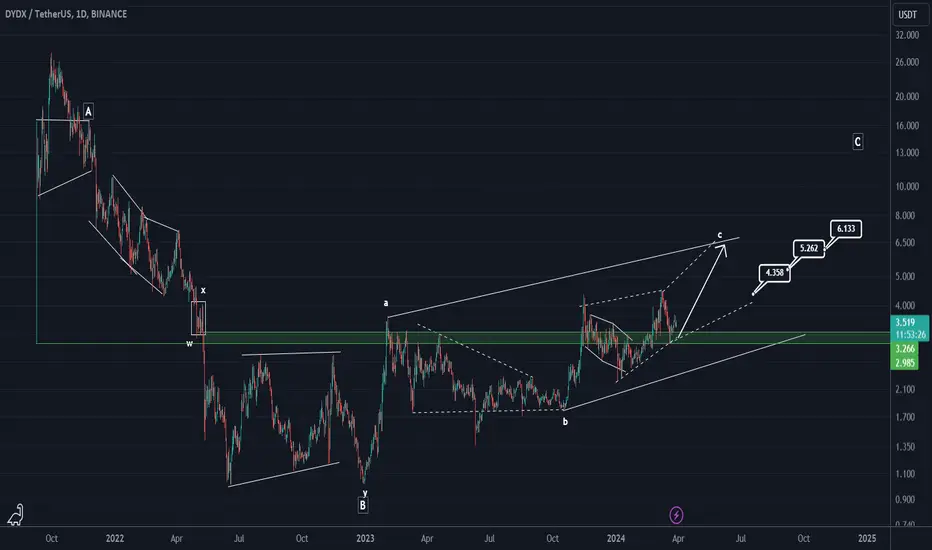
DYDX UPDATE (1D)The big A and B waves are over. Now we seem to be in the big C wave, which looks like a bullish diametric.
We have drawn a box around large waves.
If we want to focus on the structure of the big wave C, we are now in wave c of this diametric.
Wave c of C is also a diametric, so now we seem to be in wave d of c. A bullish wave of e is expected to start from c soon.
The green range is a very important support that DYDX has retraced.
The targets are clear on the chart.
Closing a daily candle below the invalidation level will violate the analysis
invalidation level : 2.699
For risk management, please don't forget stop loss and capital management
When we reach the first target, save some profit and then change the stop to entry
Comment if you have any questions
Thank You
DYDX: trade in pollback📊Analysis by AhmadArz:
🔍Entry: 3.446
🛑Stop Loss: 3.366
🎯Take Profit: 3.528-3.606
🔗"Uncover new opportunities in the world of cryptocurrencies with AhmadArz.
💡Join us on TradingView and expand your investment knowledge with our five years of experience in financial markets."
🚀Please boost and💬 comment to share your thoughts with us!

Good times ahead for DYDXDYDX is breaking above 2 years range, and this is only good. I expect a rally that will lead the price at least above $9.

Dydxusdt triple bottom opportunity"Dydxusdt showcases a strong triple bottom pattern, further confirmed by two established peaks. Despite breaking above these peaks, the price has retraced below them, signaling a potential pullback.
Our immediate area of interest emerges as an attractive buy-back zone, but for safety, consider placing stops below the pattern's bottom.
The chart displays the minimum pattern target.
Patience will be key as this unfolds. If this analysis aligns with your observations, please leave a 'like'. Thanks for the support!"


📈DYDX is going to retest or fall further📉 BINANCE:DYDXUSDT
KUCOIN:DYDXUSDT
Hello traders.
I believe in DYDX, why? Because this all-season (before or after halving) DEX (decentralized exchanges) are going to be under more attention.
right now, there are 3 scenarios in front of the traders.
in 1 & 2, the price can retest the 2- or 4-hour Bollinger midline and then retest the lower level of the pitchfork.
in 3, due to the heavy sell pressure, the price can sorely decrease below the 3.498 level. In that case, the bearish target would be $3.153.
✌💥If you are satisfied with my analytical content, please share my ideas💥✌
✍🐱👤Otherwise, make sure you leave comments and let me know what you think.🐱👤✍
🍾Thank you for your support. I hope you will gain profit by following my analyses.🍾

DYDX BULLISH?Dydx has rejected a daily bullish order block, which has the potential to result in a higher price.

DYDXUSDT.PHello Trader BINANCE:DYDXUSDT.P
the current position is in the block order area, the possibility of bullish sideways, the range area seems suitable at buy on spot 3,152.
and if the green line breakout just hold because most likely the price will continue to rise to the $9 area, but if you want to take capital, you can in the 5,158 area and then hold until the price of $9.
Please add a comment and Positive feedback and constructive criticism are important to authors and the community.
Disclamer: Not Financial Advice

DYDX ideaDydx is making a pattern of lower highs and lower lows, which serves as a favorable signal for initiating a short position.

📈DYDX quick long-position📉BINANCE:DYDXUSDT
BYBIT:DYDXUSDT.P
Hello dear traders.
If the price does not return below the $3.8 level, the bullish scenario will be strong.
✌💥If you are satisfied with my analytical content, please share my ideas💥✌
✍🐱👤Otherwise, make sure you leave comments and let me know what you think.🐱👤✍
🍾Thank you for your support. I hope you will gain profit by following my analyses.🍾


⚡ DYDX Trade Setup ⚡📊 Analysis:
Context: The Dencun upgrade on the horizon could introduce volatility in the ETH ecosystem.
Technical Outlook: DYDX on the HTF is flipping old resistance into support, potentially leading to a move to new range highs around $6.80.
Trade Percentage: Use a reasonable percentage of your capital, considering potential volatility.
Buy Zone: Consider entering the trade around $3.80 - $4.20.
Take Profit: Target potential profit levels at $4.50, $5.10, and $6.90.
Stop Loss: Implement a stop loss if the price loses support of $3.60 on the daily chart.
🌐 Note: Keep a close eye on the Dencun upgrade and adjust your strategy accordingly.

DYDX/USDT: Bullish Signals on the Horizon!The DYDX/USDT chart is showing two interesting technical indicators suggesting a potential uptrend:
Double Bottom Pattern: This formation often precedes a price increase.
Touchdown at 60-Day Moving Average: Support from this key moving average can signal a bounce.
Potential Long Trade Opportunity:
Based on these indicators, a long trade entry above the 60-day moving average (around $3.97-$3.98) could be an interesting possibility. However, remember, this is not financial advice.
Target Levels:
Here are some potential profit targets based on Fibonacci retracements:
Target 1: Fibonacci 0.5 - $4.44
Target 2: Fibonacci 0.618 - $4.48
Target 3: Fibonacci 1.0 - $5.00
Stop-Loss Recommendation:
Consider placing a stop-loss order below the double bottom's price range (around $3.75) to manage potential risk.
Key Takeaways:
This analysis highlights potential opportunities, but it's not a guarantee of future performance.
Do your own research before making any trades.
Consider using stop-loss orders to manage risk.
By understanding these factors, you can make informed decisions about your DYDX/USDT trading strategy.
Good luck!

dydxThe project is very strong, the targets are clear... Did you use an account during this time? I talked about it in the past, were you surprised?

DYDX BULLISH
I've been closely monitoring the chart for DYDX, and it appears to have been accumulating for quite some time now. Based on my analysis, I strongly believe that it's poised for a breakout, particularly targeting the $3.70 level as a starting point, with the potential to surge towards the $7 area in the near future.
This seems like an opportune moment to enter the market, as the current price level presents a favorable buying opportunity. I've taken a position myself, anticipating the upward trajectory ahead. Your interest in this analysis is appreciated, and if you find value in it, I encourage you to stay tuned for more insights.
Let's keep a close eye on DYDX as it unfolds, and may our investment journey be fruitful. Don't hesitate to follow along for further analyses and market updates. Here's to making informed decisions and enjoying the journey ahead!

#DYDX/USD#DYDX
The price is moving in a descending channel on a 1-hour frame
This channel was broken upward with stability above Moving Average 100
Entry price 2.91
First goal 3.03
Second goal 3.11
Third goal 3.21

DYDX: buy & sell📊Analysis by AhmadArz:
🔍Entry: buy= 4.110 / sell= 4.379
🛑Stop Loss: buy= 4.050 / sell= 4.456
🎯Take Profit: buy= 4.165-4.228 / sell= 4.313-4.228
🔗"Uncover new opportunities in the world of cryptocurrencies with AhmadArz.
💡Join us on TradingView and expand your investment knowledge with our five years of experience in financial markets."
🚀Please boost and💬 comment to share your thoughts with us!

✅Price is in al bullish rising channel...✌️Hi.
COINEX:DYDXUSDT
Price is in al bullish rising channel and recently bounced from the lower border of it👀
Now CRYPTOCAP:DYDX is testing a resistance zone, breaking through which the price will rush upward to the upper border of this channel🔺
✅ Due to the ascending structure of the chart...
- High potential areas are clear in the chart
-AB=CD
-Ascending Triangle
-trend line
- Ascending Channel
Stay awesome my friends.
_ _ _ _ _ _ _ _ _ _ _ _ _ _ _ _ _ _ _ _ _ _ _ _ _ _ _ _ _ _ _ _ _
✅Thank you, and for more ideas, hit ❤️ Like ❤️ and 🌟 Follow 🌟!
⚠️Things can change...
The markets are always changing and even with all these signals, the market changes tend to be strong and fast!!


- OKAAAAY LESGO!DYDX has overcome the key resistance level of $4 - pump indicated
You might like this shmoken or nuh but it demonstrates more signs of pump
In general, the current market conditions allow it.
Must overcome the $4.2 resistance level to continue growing.
Positions
market price SL 3.858
3.824 SL 3.719
3.697 SL 3.581
3.458(if you lucky) SL 3.318
Follow risk!

DYDXDYDX is making higher highs, but I have doubts because there is also a bearish divergence.
The price is likely to fall soon.
