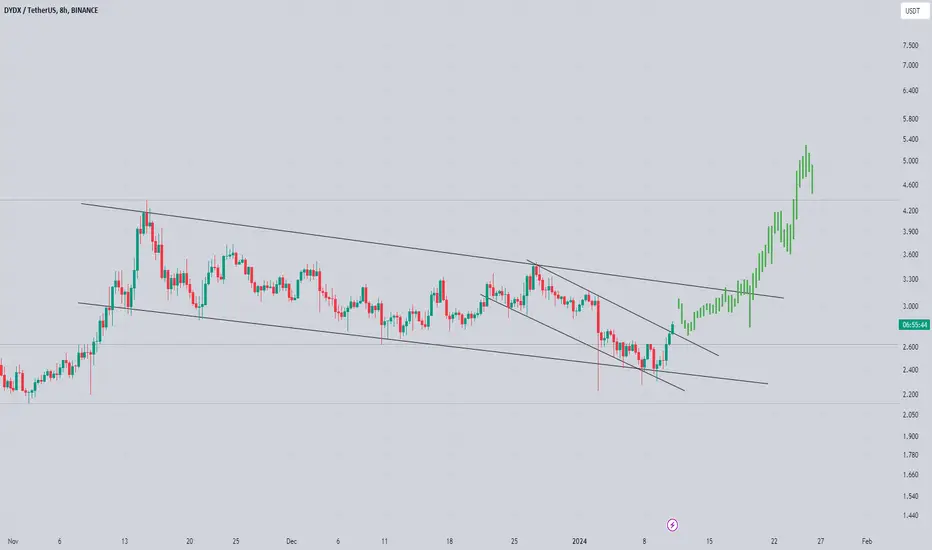
dydx Long dydx hasn't shown much potential lately. Considering the development and migration to its own chain from ethereum, this was expected. Looking at the 1H chart we see an engulfing bullish candlestick breaking out of the descending channel. This is a bullish signal to buy and HODL dydx for the upcoming weeks.
DYDXUSDT trade ideas

DYDXUSDT.1DBased on the provided market data, the DYDX currency is currently trading at a price of 2.787 USDT. The currency has relative strength index (RSI) values of 60.86, 49.29, and 52.38 for the 4-hour, 1-day, and 7-day periods respectively. These values indicate that the currency is neither in an overbought nor oversold state.
The moving average convergence divergence (MACD) values for the same periods are 0.079, -0.057, and 0.221 respectively, showing an upward trend in the shorter term (4 hours), a slight downward trend in the daily term, and a strong upward trend in the weekly term.
The Bollinger Bands (BB) for the 4-hour, 1-day, and 7-day periods are 2.991, 3.475, and 3.696 respectively, with the current price being below the upper band in all cases, indicating that the currency is not overpriced.
The support levels indicate the prices at which there is a large volume of buyers, potentially preventing the price from falling further. The resistance levels are the prices at which a large volume of sellers may cause the price to stop rising. The closest support and resistance levels for the 4-hour period are 2.645 and 3.212 respectively. For the 1-day period, these are 2.230 and 3.500, and for the 7-day period, they are 2.578 and 4.260.
In conclusion, DYDX is currently showing a mixed trend with a slight bullish signal in the short term. The currency has moderate volatility, as shown by the Bollinger Bands, and is not in an overbought or oversold state. As always, it's important to consider other factors, such as news and market sentiment, when making investment decisions.

DYDX inteligentassetNow at 2.91 resistance by 50 ema
bullish scenario
resistances 3.2, 3.52,
3.96, 4.1 upper limit of channel.
bearish scenario
supports 2.56 in 200 ema,
2.26,
2 lower limit of channel

DYDX Outlook. De-Perp Leader with 600+% Uptrend PotentialDecentralised Perpetual Leader in the Making?
An Outlook report on Perps Reliable-Beta play: DYDX Exchange as capital flows.
Date: January 12, 2024
Overview:
The DYDX/USDT pair, representing the token of the decentralized exchange dYdX on the USDT market, has been analyzed over a 3D timeframe on Binance. The data suggests a market that is highly responsive to developments within the DeFi space and sensitive to trader sentiment as indicated by the Z-Score Probability Indicator.
Technical Indicators:
Z-Score Probability Indicator:
The Z-Score has recently retreated from a peak of last quarter, which indicates a potential overbought scenario and possible retraction from those levels.
The mean reversion tendency observed suggests that the price could find temporary stability around the 2.329093 level, which coincides with previous peaks and troughs in the Z-Score.
Key Pivot Levels:
DYDX has key pivot levels that are acting as significant support and resistance zones.
Currently, the price is hovering around Key Historic Level 1 at $1.9347. A hold above this level could be bullish, whereas a break below might signal bearish sentiment.
Further up, Key Historic Level 2 and Level 3, at $3.7140 and $5.3420 respectively, are levels to watch for potential resistance and price reversal points.
Price Action and Chart Patterns:
The price action has shown higher highs and higher lows, a bullish indicator on its own. However, the market appears to be in a consolidation phase after the recent high.
A breakout above the current consolidation could see the price target Key Historic Level 2, while a breakdown below the current level could lead to a test of the lower support at $1.60, marked as a key test level on bearish outlook.
Market Context:
The performance of DYDX has to be contextualized within the broader DeFi narrative, which has seen varying risk-adjusted returns since 2023, with derivatives and perpetuals exchanges like DYDX presenting an interesting risk-reward profile for traders.
The broader market conditions, as illustrated by BTC’s performance, show that DYDX has been able to outperform BTC in the latest monthly figures, which could be a positive sign for the token’s strength in the market.
Potential Strategy:
Traders may consider a bullish position if the price remains above the $1.9347 level with an eye on the key historic levels as potential targets.
Conversely, a bearish stance may be warranted if the price breaks below the current pivot level with a target of $1.60, aligning with the bearish outlook test level.
Risk Management:
Invalidation on break of channel below.
Traders should also consider the macroeconomic factors and DeFi space developments, as these can have a substantial impact on DYDX’s price.
Conclusion:
DYDX/USDT appears to be in a crucial phase, with key pivot levels acting as determinants for future price action. The recent pullback in the Z-Score indicates a potential cooling-off period, which could be followed by a decisive move. Traders should monitor these levels closely and be ready to adjust their strategies according to the breakout direction.
This analysis is for informational purposes only and does not constitute investment advice. Always conduct your own due diligence before trading.

DYDX/USDT Preparing for an Exclusive Bull Run? 👀🚀DYDX Analysis💎 Paradisers, focus your attention on #DYDXUSDT, as it's showing signs of a potential bullish breakthrough from its support zone.
💎 #dYdX is currently exhibiting a strong upward trend, with high expectations for a bullish move from its present demand level. If #DYDX can sustain its momentum above the $2.303 mark, there's a good chance we could see a substantial movement towards the significant resistance at $4.23.
💎 In the dynamic world of cryptocurrency, the ability to adapt and modify strategies is key. If #DYDX struggles to maintain its ground above the $2.303 demand level, we might need to consider a strategic redirection.
💎 Under these circumstances, our focus would shift to a potential bullish move starting from a lower support level at $1.87. Monitoring this level becomes essential, as falling below it could prompt a strategic change, reflecting possible difficulties in maintaining a bullish trend in the #DYDX market.

finally dydx getting ready to move towards 5 to 6$ trend is already up and now consolidating in bullish flag and expecting breakout incase of successful breakout expecting massive bullish rally
successful breakout can lead bullish rally towards 5 to 6$ in coming weeks keep eyes on dydx
DYDXUSDT # 001 ( Wait for Correct Time & Price Entry $$$ ) Hello dear traders.
Good days .
As 2024 is Crypto party , specially Altcoines will be beneficial .
DYDXUSDT passed First Gann Square Cycle and is on 2nd crazy Bullish Cycle .
First leg of Elliot is finished and it is on Bearish phase .
Daily Bearish Gann Square is not finished yet and need mor3 correction to get support from lower Gann Fan line ( about 2.6 $ ) for upward move .
In detail chart will update .
Enter at correct Time and Correct Price .
Chart updated and route plotted with help of Gann Square and Gann Box.
Good luck and safe trades.
Thanks for your support and comments

DYDX - Structurally SoundDYDX is beginning to look very good on the weekly. Here are some key indictors that could point to dydx finding a low soon.
-0.618 of current trend was just tested
-Close to lower band of support (price could visit $2 if 0.618 does not hold)
-Weekly RSI uptrend structure still holding (green circles)
-Lower timeframes creating bullish divergences
-Currently testing 1D 200 MA
-Currently testing 3D 100 MA
-Currently testing 1W 100 & 50 MA

DYDX/USDTEverything is clear in the chart, how do you see the future? More pump or price drop?
LIKE & COMMENT

$DYDX noticed crv and 1inch moving so assuming dydx is due for some relief as well
not in this currently will hop on closer to the white line
flip yellow line or previous rejection to continue

DYDX HTF IdeaOne of my favourite assets as it respects my strategies very well. I could be completely wrong with this one and as usual I'm playing level by level.
The substructure is very difficult to outline for now, but I'm watching 4h and daily charts in the interim areas marked on the chart for potential internal trend reversals. I'm aware of the bullish scenarios, but this makes the most sense to me. It'll be a fun ride if the lower levels come on time.

DYDXIf the support line is broken, the price will reach to 1.4 and then to 1
Wyckoff redistribution schematic

DYDX Token UnlocksTechnical analysis :
DYDX near channel up support level at 2.953, if this support able to hold bearish movement, bullish target at 3.611
But if it break down, bearish will reach 2.511 or maximum target at major support at 2.062
Fundamental analysis :
DYDX already unlocked 34.2% supply and will unlock $101.67M or 12.35% supply tomorrow.
Mostly unlocking large quantity supply will create short term dump.

"DYDX/USDT Long Alert 🚀: Potential Rebound from Strong SupportLONG #DYDX/USDT
"DYDX is currently trading above the long-term established support level, and there is anticipation of a significant rebound from this point."
📈Entry Point: CMP). Additionally, be prepared to add more positions if the price drops to $2.652
💹 Targets: $2.860 $2.992 $3.143 $3.627 $4.3
⛔️ Stop Loss (SL): $2.556 to limit potential losses.
📊 Leverage: 5x to 10x
R:R :- 1:6 (Lucrative)
Use leverage cautiously and in accordance with your risk appetite. It's advisable to be conservative with leverage to mitigate the risk of significant losses.
Remember, This is not Financial Advice!

On the Bullish Road, DYDX has to stop at some station | LongBiasOn week chart
DYDX has grown through 1 year and reached to 4,363 on Nov 2023
Now, DYDX is pulling back to lower to accumulate awhile before going up
My view for this bullish around 6,3 that's #SupplyZone
DYDX has #Support around 2,17 this zone is #Apex between two trend lines
Time will tell


📉 DYDX: Awaiting Shakeout for Further Ascent 🚀DYDX is currently navigating a substantial ascending wedge pattern, having recently experienced a swift breach of the upper boundary that prompted a notable short-term reaction. The current phase involves a retest of the previously contested resistance, which has now transformed into a support zone. A potential shakeout beneath the lower wedge boundary is anticipated to capture liquidity before embarking on the next leg of the upward movement.
📊 Key Observations:
📈 Ascending Wedge Dynamics:
DYDX is ensconced within a large ascending wedge, presenting a structure that often precedes decisive market movements.
🔄 Retesting Transformed Support:
The ongoing phase involves a retest of the support zone, formerly a resistance level breached during the recent upswing.
📈 Technical Analysis:
🔄 Shakeout Anticipation:
Anticipation of a shakeout beneath the lower boundary of the wedge, designed to capture liquidity and set the stage for the next bullish phase.
🚀 Expected Shakeout Strategy:
🔍 Liquidity Capture:
The shakeout aims to secure liquidity from both sides of the market, setting the groundwork for a robust and sustained upward movement.
📊 Strategic Considerations:
🧐 Vigilance during Shakeout:
Traders are advised to remain vigilant during the anticipated shakeout, recognizing it as a strategic maneuver to capture liquidity before a potential surge.
📝 Conclusion:
DYDX's current chart setup, characterized by an ascending wedge and a transformed support/resistance zone, points to a calculated shakeout as part of a broader market strategy. Traders should monitor this phase closely, recognizing its role in securing liquidity for the ensuing bullish momentum.
🚀 Unlock my 3 crypto trading indicators for FREE! 🚀

DYDX - BUY SETUP (DEC 2023)DYDX - BUY SETUP
Based on technical analysis, the current setup of this coin appears to offer a favorable buying opportunity. The price action and key indicators signal promising trends, suggesting a potential advantageous entry point. However, prudent consideration of market volatility and risk management is essential before making any investment decisions in the cryptocurrency market.

DydxLooking exceptional here..
If we can hold above the old listing price ~3$ then we can start to look to the old ranges (way up ~20$) for new targets..
This thing is exceptionally functional does basically everything a premium dex can offer
Itll have a monster cycle
Is the largest volume perp dex on any network..

2-leg for buyer (DYDX)❤️❤️Thanks for boosting 🚀 and supporting us!
📈We are in small bull-trend so trade with trend but low R/R (2).
📊 (Entry) : 3.373
🔴 Stop Loss : 3.215
🎯 Take Profit : 3.523-3.693
🔗 For more communication with us, In the footnote and send a message in TradingView.
👨🎓 Experience and Education: Our trading team has five years of experience in financial markets, especially cryptocurrencies.


DYDX creating a falling wedge pattern on 1Dfalling wedge on CRYPTOCAP:DYDX on 1D
going to start building a long position on this. An example trade idea given with proper risk/reward for the trade
