New Bullish Move To The 4$👉 Currently The Price Breakout From The Trend Line And I Expect a New Bullish Move
📥 Targets Are 4$ And 5.3$
DYDXUSDT trade ideas

DYDX flight is not over yet!Hello trader! Today I have a new idea for you. Like and subscribe to the channel, there is a lot of useful information there.✅
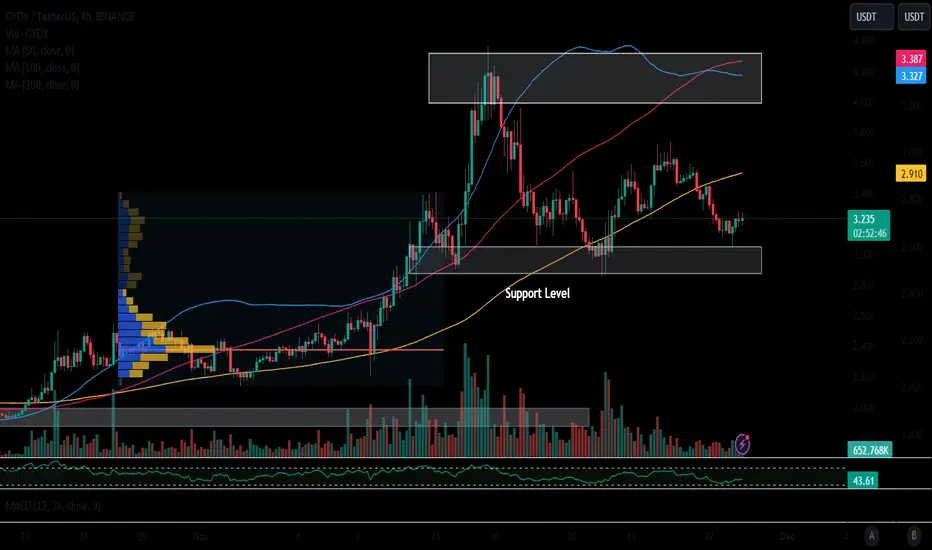
Technical: prolonged growth has formed a structure with a downward movement and has broken through the local countertrend, there is the potential to reach an update high towards $3.9-4.
I do not rule out that there may soon be a squeeze movement down all alts, so be careful with your leverage! In theory, you can try to take 10-15% from here without leverage.


DYDX target 612 he time frame
-
DYDX is creating a long-term bottom structure, and if we can mark three resistance zones through Fibonacci Extension, that are 4.8~5.1 / 5.6~6 / 6.95. Also, DYDX is breaking out a triangle structure in lower time frame, which allow us to set up a trading plan that risk to reward ratio is almos 9.
TP: 4.8~5.1 / 5.6~6 / 6.95
SL: 2.7

[DYDXUSDT.P] Long to Short IdeaThis idea uses supply and demand with harmonic pattern (butterfly) as confluence.

DYDXDYDX is a American decentralized exchange
Due to Binance exchange situation,I expect a good move for this gem

#DYDX
#DYDX
is poised to break out of its symmetrical triangle on the daily timeframe. If the breakout is successful, a move towards $5 is expected.


#DYDX/USDT#DYDX
The descending triangle was breached strongly and stabilized above the downtrend
After it was broken, supported by a strong rise in Bitcoin
The rise is expected to continue to the next resistance level at $3.17
Which represents 150% of the current price of $2.32
This trend is supported by the volume currently on the market

DYDXUSDT LONGI think DYDXUSDT will come down to the green trend line and reverse trend upwards to the upler green trendline basically staying in this big downwards channel.
Entry : 3.014
TP(100%): 3.23
Entry 2.: 3.13( After reaching TP)
TP(100%): 3.3

DYDX targetting $0.50 and below, watch out. EDIT: It is also Important to note, that over $9million was allocated a week ago for compensation for the November 17 liquidations incident.
Read here: forums.dydx.community

DYDX Chain Starts Paying Trading Rewards Following DAOKey Takeaway
1. dYdX Chain has enabled trading rewards for users of its decentralized derivatives protocol following the launch of full trading on the new Cosmos-based Layer 1.
2. A six-month incentive program has also been initiated, offering rewards worth $20 million in DYDX tokens.
Cosmos-based Layer 1 dYdX Chain has begun distributing rewards accrued from trading activities to users, following the commencement of full trading on the decentralized derivatives trading protocol, which was greenlit by a decisive governance vote.
The beta mainnet of dYdX Chain was launched on November 14, initiating "active trading" across more than 33 markets with leverage of up to 20x. During the beta phase, although staking rewards were active, trading rewards were not being distributed, yet users were accruing 100% of the protocol’s trading fees. Following the conclusion of the governance vote earlier today, trading rewards are now fully enabled. Staking rewards for validators and stakers will continue to be paid in USDC and DYDX.
Since the launch of the beta stage two weeks ago, the protocol has seen over $1.86 million in total trades across roughly 14,000 transactions, as reported by the dYdX Operations subDAO, which manages the decentralized infrastructure of the dYdX Chain.
Initially, just four markets are available for full trading: BTC/USD, ETH/USD, SOL/USD and LINK/USD, with more markets to be added over the coming weeks, the dYdX Operations subDAO said.
Migrating from Ethereum to the Cosmos ecosystem
The alpha mainnet for dYdX version 4, along with the debut of its Cosmos-based blockchain, was launched on Oct. 26, signaling a notable transition for the leading decentralized derivatives platform to become a standalone Layer 1 on Cosmos after previously relying on Ethereum Layer 2 scaling solution StarkEx in version 3.
Users migrating from Ethereum to the dYdX Chain utilize the wethDYDX smart contract, a one-way bridge facilitating the exchange of ethDYDX tokens for wethDYDX on Ethereum and DYDX, the native token on the dYdX Chain. There are currently over 437 million ethDYDX bridged and 16.45 million DYDX staked to the dYdX Chain, according to the dYdX Foundation.
Incentivizing early adopters
The dYdX community also approved the introduction of a six-month incentive program today, proposed by Chaos Labs. The program earmarks $20 million in DYDX tokens to be distributed among early adopters of the dYdX Chain, aiming to boost adoption and trading volume.
The program is also designed to prevent abusive behaviors, such as wash trading, and each distribution of the DYDX rewards is subject to approval from the dYdX community.
The dYdX platform ranks as the most extensive decentralized derivatives trading platform in crypto, with a cumulative volume of over $1 trillion since 2020.

Dydx to 2.440We might see a downward move to $2.440 before we move up to $5.7
Get ready for the pump

dydxThere is a resistance in the box that can be a little annoying
If it passes, the above targets are available
The first support point is the green line

Is DYDX about to do what QTUM did ?DYDX is a well used derivative DEX
Can check on tokenterminal the fees being generated and the daily users on DYDX. It is gaining traction and should get a whole lot more come bull market.
Very strong fractal
As QTUM did previously, DYDX has fallen a lot since launch. However after 100ma appeared on the weekly timeframe and price was able to catch it... QTUM launched all the way back moving 14x from support (more from lows)
DYDX looks on trend to follow
Considering fractal and increasing fundamentals.. it seems increasing chance that DYDX does something similar and is something to keep a very close eye on!!


DYDX may continue to rise according to the cup handle structure🧠As we mentioned in the previous post, our pullback may be over and we are in the middle of a rally driven by the bottom double bottom long structure. In the 15m chart, we have successfully broken through an important inflection point to form a cup handle bullish structure, so the rally with the long structure as support should be very efficient.
⚠️Note that this bullish view will be invalidated if our long defensive point is broken.❌
Let's see👀
🤜If you like my analysis, please like 💖and share it💬
💕 Follow me so you don't miss out on any signals and analyze 💯

DYDXUSDTmy entry on this trade idea is taken from a point of interest BELOW an inducement.. SUPPLY AND DEMAND TRADING!.. just a trade idea, not financial advise

Dydx Trying Fifth Time Dydx is currently making its fifth attempt to break this resistance level. There is anticipation for an impending breakout, potentially signaling a bullish trend. A surge of 30-60% in the near-term is foreseeable, should the breakout occur.
Disclaimer:
This analysis is purely speculative and not intended as financial advice. It's essential to conduct your own research before making any investment decisions.

DYDXYSDTDYDXYUSDT is in bullish trend .
Potentially printing HH and HL.
No sign of trend reversal.
We wait and watch for the breakout of last HH.

DYDX The road to 4Great came back for DYDX that bounced exactly on the my entry point. What to expect now? It's in great shape, but we can see a small retrace till 3.18 before resuming the run. 4 USD is still in play, and probably 5 before EOY

📊#DYDX may continue to fall based on the rising wedge pattern📉➡️After we rose based on the bottom double bottom structure, all the goals of the small long structure have been achieved, so the current callback is very reasonable. Given that there is still a large bullish structure, we will still be bullish in the big cycle.📈
🧠But for small cycles, we are in a short structure, making a healthy correction, and forming a rising wedge model during the correction (generally we fall according to this model). At the same time, I am also very much looking forward to the arrival of this decline, because when we pull back to the buy zone, the best buying opportunities will appear.💯✔️
⚠️Note that if we continue to rise and break through the short defense point, it means that the short structure is destroyed, which means that we will continue to continue the bull power.💪
Let's see👀
🤜If you like my analysis, please like 💖and share it💬
💕 Follow me so you don't miss out on any signals and analyze 💯
