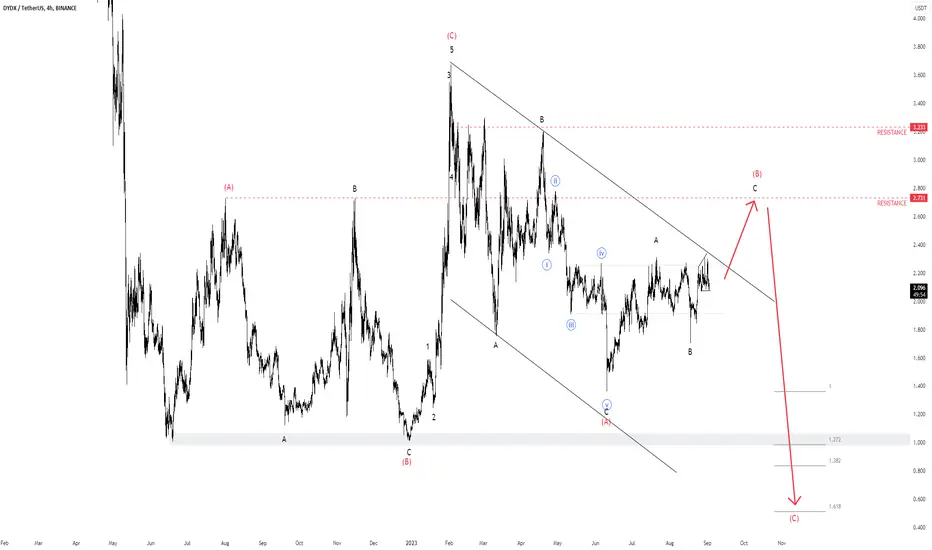
dYdX dump to $0.50 from $2.7-$3.3 rangeI believe we're currently making C of red (B) at around resistance areas of $2.7 to $3.3 from where we can head down towards red (C) to price level of $0.5 so lets look for shorts!
DYDXUSDT trade ideas
DYDXDYDX unlocking token and red market may make this happen.
It's not a financial advise
Always DYOR
Good luck

DYDX longDYDX bounced off the ascending trendline and bounced off the support level. Bullish movement to resistance level at 2.3 is expected to happen.

Resistance Ahead | Third time lucky or notWeekly Chart
BINANCE:DYDXUSDT is moving up to resistance zone around 2.4 and this is third time try to break resistance.
Daily Chart
DYDX is trying to test resistance at 2.3 if it's achieved, it will confront the strong resistance at 2.4 that is big challenge
Time will tell

$DYDX Soon BREAKOUT and FLIP LEVELCRYPTOCAP:DYDX is showing massive strength
The CRYPTOCAP:DYDX V4 upgrade is coming in late September and this is huge
DYDX is one of the highest earning dexes with the best UI/UX experience
They will be sharing 100% of revenue with CRYPTOCAP:DYDX stakers
CRYPTOCAP:DYDX will also be adopted as the native token of the DYDX cosmos chain
This has potentially high upside from here.

DYDX Short TradeLooks like it is rejecting from the range high.
SL above the 50% of the wick
Entry: 2.25
SL: 2.28
Target: 2.07

DYDXUSDT wants the false breakout?In the landscape of the DYDXUSDT trading pair, a notable development has surfaced with the price currently testing the daily resistance. This testing phase is transpiring within the context of both a triangle pattern and a descending channel. These patterns offer valuable insights into the market's current dynamics and potential future movements.
The triangle pattern signifies a convergence of the price's highs and lows, resulting in a narrowing price range over time. Simultaneously, the descending channel further characterizes the market's behavior, showcasing a sequence of lower highs and lower lows within a defined channel structure.
Of particular interest is the possibility of the price capitalizing on the false breakout that transpired in the $2.3 area. False breakouts, where the price briefly breaches a key level before reversing, can lead to a liquidity grab as traders' positions are triggered, potentially resulting in a swift price movement.
Following Plancton's rules, this scenario might align with a new short position opportunity. Plancton's approach emphasizes the importance of confirmation and adherence to specific criteria before entering trades.
To align with Plancton's rules, traders are encouraged to:
Confirmation: Wait for a clear and sustained breakdown below the support level of the triangle or descending channel. This confirmation involves ensuring that the price remains below the level and is supported by factors like increasing volume.
Technical Indicators: Utilize technical indicators such as moving averages, oscillators, and trend confirmation tools to assess the strength of the potential breakdown.
Risk Management: Implement effective risk management strategies, including setting appropriate stop-loss levels and considering position sizing. This helps manage potential losses in case the market movement doesn't align with expectations.
Patience: Exercise patience and wait for a definitive confirmation before entering a trade. False breakouts can lead to losses, so caution is paramount.
Market Context: Consider the broader market context, news, and events that could influence the price movement of DYDXUSDT.
In summary, the DYDXUSDT trading pair is currently engaged in testing the daily resistance within the confines of both a triangle pattern and a descending channel. The potential for a new short position based on the premise of liquidity grab from the false breakout is in line with Plancton's rules. However, thorough analysis, careful execution, and risk management are crucial components of making informed trading decisions within this context.
–––––
Follow the Shrimp 🦐
Keep in mind.
🟣 Purple structure -> Monthly structure.
🔴 Red structure -> Weekly structure.
🔵 Blue structure -> Daily structure.
🟡 Yellow structure -> 4h structure.
⚫️ Black structure -> <= 1h structure.
Follow the Shrimp 🦐

DYDXUSDT LONG OUTLOOKHello Traders, this is outlook that i think might be work. All Entry, Stop Loss, and Take Profit its already showed up. All trade it is on yourself. DYOR.

DYDXUSDT short I'am taking short position on DYDXUSDT as a white trend line was broken retested and i expect the price to fall to the yellow trend line. I'm entering now at 2.085
TP(100%): 2.046

short dydx## Risk & Management
- 1% capital per trade.
- Move SL to breakeven at 1:1R
## Points of Interest
- Order blocks
- Major liquidity grab
## Framework
- On the 4H timeframe, gauge overall bias & locate major points of interest.
- When price enters a point of interest, drop down to the 15M or 5M timeframe.
- Wait patiently for price to purge liquidity within the point of interest.
- Wait for price to impulsively break structure & create imbalance.
- Enter at the order block responsible for the break of structure.
## Entries
- The OB caused a BOS.
- The OB is the extreme zone.
- The OB created clear imbalance.
- Liquidity has been clearly Identified.


DYDX /usdt looks bullish Mid market cap pairs showing short term bullish trend ,
two levels to entry 2.1-2.12$ and 1.98-2.01$
at moment btc move is not too effective on ALT pairs ,which mean will give more opportunity to low and mid market cap pairs .

dYdX Tight RangeThe price of dydxusdt went up a lot yesterday. Now, I think the price needs to calm down a bit. My expectation is that the price will go back up again to a certain level. This level is where the price was before and acts like a support area. This should help the price to keep going up.
There is a level at $2.203 where the price has had trouble going above. It's like a strong wall. Instead of trying to go over it in one big jump, I expect the price to go up and down around this level a few times. This can make it easier to finally break through this level.
Daily timeframe shows more details on overall picture:

DYDXUSDT 1DSymmetrical triangle formation on daily chart. Expecting breakout 📈. It is testing the resistance and MA200. Wait for the confirmation. Targets are on my chart.

Dydx Getting Ready For Massive Bullish Rally Seems Like Long Consolidation Getting Closer To Break to The Upside Formed Symmetrical Triangle And Breaking out In Daily Tf Incase Of Successful Breakout Expecting Massive Bullish Rally In Midterm
Incase Of Successful Breakout Expecting Move Towards 5.50$

DYDX Buy TradeHere is My Study on DYDX.
Welcome to my channel! Here you'll find daily technical analysis ofthe latest trends in the crypto market. From Bitcoin to altcoins, I'lIl be sharing my insights and predictions to help you make informed decisions
about your investments. Follow me for the latest updates and join the conversation in the comments!
Crypto technical analysis uses past price history to predict future price. It's not a guarantee and shouldn't be relied on solely for investment decisions. Consider other factors such as market trends, economic strength and
information dissemination. Use with caution.
This Is Not A Finacial Advise

DYDX longDYDX bounced off the support level. Asset broke trough off the descending trendline. Bullish movement to resistance level at 2.18 is possible.

DYDXUSDT - The Dawn of a Bullish OdysseyDYDXUSDT has impressively rebounded from its supportive uptrend trendline.
Notably, it shattered the downtrend trendline with assertive momentum.
With such a favorable risk/reward scenario, we're taking a bullish stance on this coin.
Gear up! We anticipate the upward march to commence starting today.

Update DYDXThe general shape of this update gives me the possibility of forming a leading diagonal wave, which is wave A of a composite wave Y, and all the data is on the chart
Note: the analysis fails if the price closes in the highest area 2.31 usdt
Please clarify that I am helping you with my point of view, which may be right or wrong, and see my previous analyzes of many currencies and forex in order to judge the owner of this analysis with a more accurate look
Good luck


DYDX longCRYPTOCAP:DYDX is bouncing off the support level and the ascending trendline. Bullish movement to resistance level at $2.24 is possible.

DYDXUSDTBINANCE:DYDXUSDT LONG
⚠️Note:
In this type of signals, only the entry point and trade direction are specified, and stop loss and target are not determined.
If you are interested in entering these signals, please provide a stop loss and a logical market-based target.
⛔"Daily crypto market analyses I provide are personal opinions & not financial advice. Trading carries risks, so do your own research & seek advisor's help.#DYOR"
Don't forget to like and comment
