DYDXUSDT trade ideas

DYDX short setupBTC is bearish in my opinion and DYDX needs to take those dynamic & static liquidity areas
(This is a very risky setup)

DYDXDTDX Technical analysis basically on elliott waves Principles and trend analysis
Dydx can be grow to 10$ very good opp to buy after breakout on 3.50$
Wait and watch.

DYDX/USDT RELOADED CHARTTHIS is the chart i am publishing again coz moderators did hide my previous published chart coz of house rules violation.
All targets achieved as mentioned above.

DYDX - Decentralised Perpetual Protocol - High conviction Setup DYDX - Decentralised Perpetual Protocol - High conviction Setup $DYDX
Retest $2.7 level and the prolly next target is $4.42

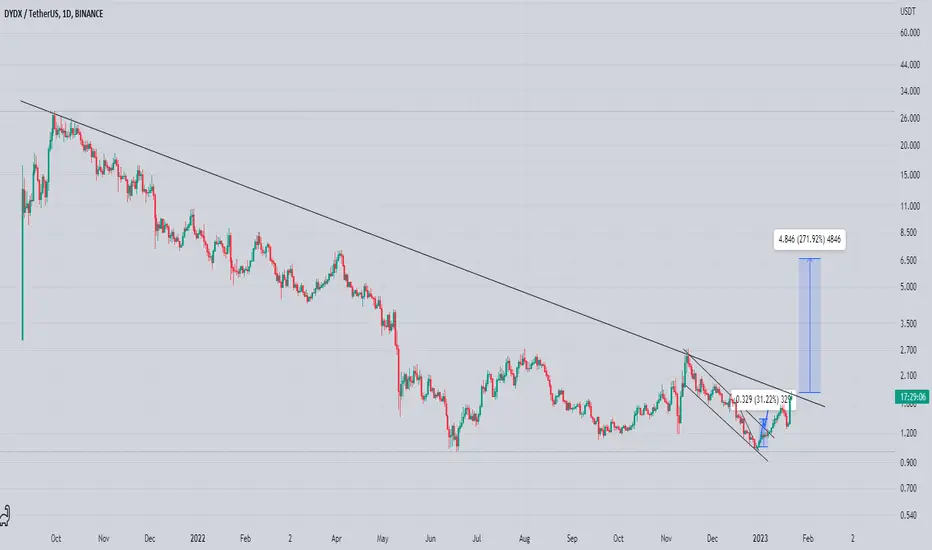
Dydxusdt Testing Major Trendline Testing Major Trendline In daily timeframe
Incase Of breakout Expecting 200%+ Bulish Move
Always Wait For confirmed breakout Place Sl according YOur Risk Reward
DYDX (Y23.P1.Video1) #WYCKOFF Alignment spot onHi Traders,
This is a cointinuation of the previous post on DYDX.
I talk about targets and how they are aligned to some fibs and if it correlates well with BTC, then this makes sense.
I also give a #BTC update on this.
Please give me a like and share,
Regards,
S.SAri

DYDX (Y23.P1.E1).WYCKOFF Alignment spot onHi Traders,
Hope all is well.
The schematic tells the story., so far aligned and likely targets are the fib 1, then a pause to only continue to fib 1.414 and 1.618.
Please give me a like and share,
Regards,
S.SAri
We need to close above the TL and 618 to go long


DYDXUSDT Elliott Waves AnalysisHello friends.
Please support my work by clicking the LIKE button👍(If you liked). Also i will appreciate for ur activity. Thank you!
Everything on the chart. (update)
im still in pos, targets is relevant
Entry: market and lower
Target: 3 - 4 - 5
after first target reached move ur stop to breakeven
Stop: under 1 (depending of ur risk). ALWAYS follow ur RM .
risk is justified
Good luck everyone!
Follow me on TRADINGView, if you don't want to miss my next analysis or signals.
It's not financial advice.
Dont Forget, always make your own research before to trade my ideas!
Open to any questions and suggestions.

Dydx ,, Technical analysis Dydx easily rejected the resistance and can continue her beautiful and unique movement.

✴️ DYDX Leads Bitcoin | This Is What Follows... Think Long-TermNotice that a retrace/mini correction happened between 16-19 January, this is true for the entire market.
Now we are seeing some doubt due to 1 single day of red and the fed meeting tomorrow... But see what is happening, Litecoin hit a new high, Dogecoin hit a new high, Fantom hit a new high and this one, DYDX is also going strong and hitting high.
The entire market is one, connected, and so this reveals what will happen to the king and what is happening to the market as a whole.
The cryptocurrency market is set to continue with its current growth!
DYDX is showing really high volume.
This is one of the "strong one" because we have a higher low December compared to June, by a few cents.
The volume is super high.
The RSI is ultra-strong.
Still trading below EMA300 though...
DYDXUSDT hit its highest level since May 2022.
The long-term downtrend has been broken for a while now.
Any retraces and corrections can be used as an opportunity to buy-in, rebuy and reload.
Think long-term.
Buy and accumulate, hold!
Namaste.

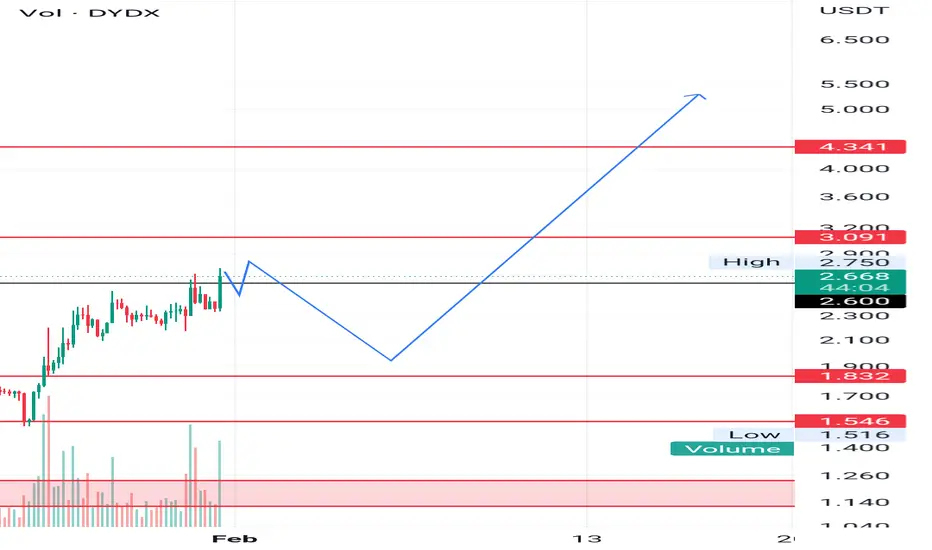
#DYDXUSDT #LQRUSDT #TOBTC #LaqiraProtocol break ResistanceIf the static resistance level is broken and if the price stabilizes above this level, we expect to rise to the Fibo level of 1.618 at the price of $3.758.
Minor resistance $3.33
Support $2.65 and $2.5

DYDXUSD ❕ growth on unlock transferDYDX is oversold by RSI and BB indicators.
A bearish divergence has been formed on several timeframes.
I expect reversal for a local correction.

DYDXIdea: The price has formed a triple bottom and is trying to break through a strong resistance level. The price is in the zone of strong overbought. The correction will bring the price down to the POC level. Bullish scenario will push the price up to $4.2

DYDX bull trendHello, i'm new
With the unlock pushed back
Only with btc bull's trend or stable
dydx can keep bull trand after correction
what doyou think ?
have good day

DYDXUSDT | Is it time for a correction or will growth continue?Hello trader Today I have prepared a new idea for you. Like and subscribe to the channel there is a lot of useful information✅
Friends, I take another altcoin into account, I have been following this coin for a long time, but I didn’t buy it, to be honest, I didn’t expect to see such a strong growth from the old man.
A little description for those who see this project for the first time:
It is the most popular decentralized margin trading platform with a peak value of over 150.000 ETH (which was over 2019 million dollars at the time) closed on its smart contracts in November 2020. As of April 500, the platform has sold over $500 million. Now you understand where the Margin on your huge shoulders comes from :)
So, let's get closer to speculative positions, I decided to open a small short for literally 1.5% of the deposit.
Deal plan:
I will place limit orders as usual, because the withdrawal may continue.
Entrance - 2.950/3.100/3.150$
Stop set $3,450
Teiki will be updated.
The transaction is carried out with a leverage of 1X minimum risks on altcoins guys;)

DYDXUSDT Triple Bottom!What is the triple bottom?
The triple-bottom reversal pattern has three roughly equal lows and indicates an opportunity to take a bullish position. Before the triple bottom occurs, the bears are usually in control of the market, forming a prolonged downtrend. The first bottom does not indicate anything out of the ordinary. Still, the second and third bottoms show a change in direction where buyers (bulls) may push the price action higher after the price breaks through the resistance.
Dydx is currently trading at 2.89
The DYDXUSDT has broken its triple bottom resistance line after 8 months of ranging market, indicating a strong bullish sentiment. and you can see high trading volume in the daily chart, expecting a potential up move.
Thanks
Hexa

DYDXUSDT | UPDATE...Previously DYDX has given breakout by breaking above the falling wedge.
From our last analysis the price has already gain 130%.
Now currently the price has broken above an important resistance area.
The price has broken upside with a volume.
The bulls are in control.
Manage your trades accordingly.


Dydxusdt(based on NEo wave)Wait for the correction,I will update that when I see its finished.it will surprise you after the correction ends.
Has it on your watchlist.
DYDXUSDT Resistance Zone Breakout!DYDXUSDT Technical analysis update
Buy zone: Below $2.65
Stop loss: $2.15
Take Profit 1: $3.05
Take Profit 2 : $3.70
Take Profit 3 : $4.20
Max leverage: 1x
Always keep stop loss

DYDX BOTTOM ACCUMULATION? DYDX is forming a nice accumulation base, potential bottom.
One to look out for!
