#DYDXUSDT #LQRUSDT #TOBTC #LaqiraProtocol break EMA200The breaking of EMA200 and its high stabilization
EMA200 at $2.123 is the first price support
Fibo level resistance at $2.506
Static resistance $2.6 and $2.82
DYDXUSDT trade ideas

DYDXUSDT idea✅ ✅ Risk warning, disclaimer: the above is a personal market judgment and analysis based on published information and historical chart data on The trading view,
And only some of these analyzes are my actual real trades.
I hope Traders consider I am Not responsible for your trades and investment decision.


#Dydx | #UsdtI think #Dydx is bullish (15M)
Targets : Green lines
Don't risk more tha 3% of capital.
____________________________________

DyDX to 3.031Opinion:
DyDx to 3.031
Risk seems limited. Trend is upwards. Looking good.
Short term in-out.

Long Entry at Channel Bottom for dYdXGreetings, Snipers!
DYDX has dropped >95% since its peak in 2021
DYDX is currently at the bottom of its channel range at $1.00-$1.20, with previous strong retracements
This may draw a potential sideway channel or a triple bottom pattern
The $1.00 level is expected to be a strong psychological support
$2.30 - $2.70 have posed to be a strong resistance level
In the shorter time frame, we can trade this channel:
We can take a long-entry now, at $1.00 - $1.10, and sell at $2.30 for a Risk-Reward ratio >5 (SL at $0.84).
Please be mindful that Bitcoin is on the verge of breakout of its continuation pattern to the downside, so manage your risks well!
Happy Sniping!

100% PROFITI Think it will do the same pattern
we need about 30 Day's to go to the buying zone
and about 30 Day's auther to go to 2$ zone again

Dydx reaching Its supply zoneIt started its movement abit sooner than expected. after a compression around MA200.
Now I expect to see a reach a supply zone. then , the next move by forming a divergence in MACD.

DYDXIdea: The price has broken the daily 200 EMA and 300 MA and is trying to break the weekly 50 EMA and a strong resistance level. The news about the transfer of the unlock affected the price increase. A correction could bring the price down to the POC level. Bullish scenario will push the price up to $3.2

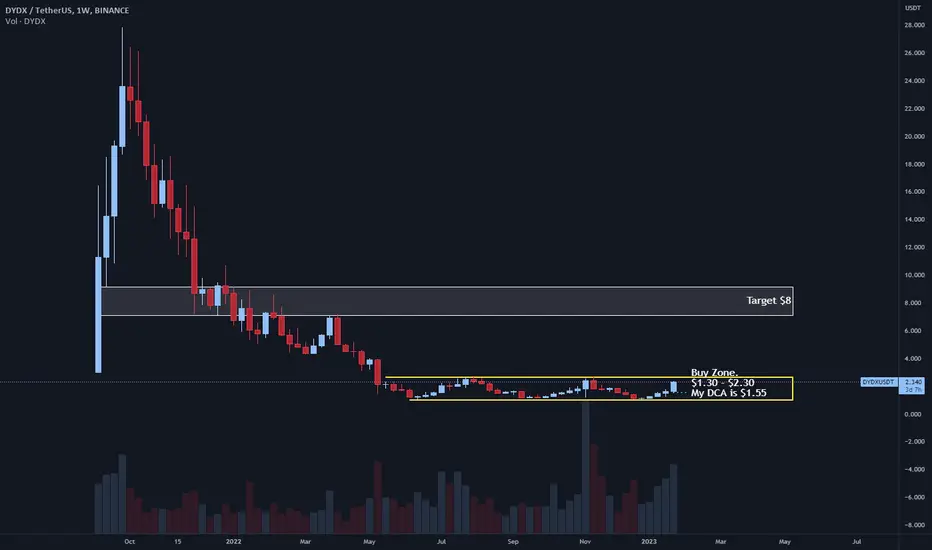
$DYDX will leave you behind scratching your head.FIFTH EXAMPLE!
I wasn't going to give more examples of what Altcoins to look for, but this one is a good one and I couldn't help but share it.
$DYDX
Looking for Targets of $8 within a few weeks/months.
KEEP AN EYE ON THIS ONE!
My DCA is $1.55
I have no SL, This is SPOT!
Try and buy before the Darvas Box accumulation breaks outs.
All this depends on $BTC and the continuation of the market. but select coins (Such as this) might not even care about the Bitcoin Market once they move big.
DydxDex protocol tokens appear to be ending the range bound accumulative phase
77% upto around 4$ if we break out of this range

DYDX/ USDT Ida and forecastDYDXUSDT
✅ ✅ Risk warning, disclaimer: the above is a personal market judgment and analysis based on published information and historical chart data on The trading view,
And only some of these analyzes are my actual real trades.
I hope Traders consider I am Not responsible for your trades and investment decision.

DYDXUSDT(dYdX) Daily tf Range Updated till 26-01-23DYDXUSDT(dYdX) Daily timeframe range. price action isnt stable consider how big its range levels are. there are volume and mid retail interest that do had its effect. if the interest keeps us there are some optimal scalp positions here and there.

DYDX break out of that downtrend!Here we have DYDX getting close to the downtrend resistance and having a triple bottom to back it up for another attempt. Let's go bulla bullas!


DYDXUSDT SHORT OPPORTUNITYHere we can see that "DYDXUSDT" in 1 day time frame has a trendline resistance at "1.981" and you can see a good short opportunity.
ENTRY - "1.981"
TARGET - "1.576"
STOPLOSS - "2.073"
ENJOY!!!!!

DYDXUSDTHello Crypto Lovers,
Mars Signals team wishes you high profits.
This is a one-day-time frame analysis for DYDXUSDT
Based on our previous analysis on January 8, we expected a rise will happen in the coming days and presently we see the precise prediction of our team. Here we have R1 as the resistance area that expresses the price was not able to rise at different points. S1 used to be another resistance area. And at the bottom of the chart, S2 and S3 are our support areas which include the well support of price at several points. Hence, we have the price fluctuating below R1 and we expect it to have some rising signs and increase would be there for the price up to R1 or above that. Also, if the price loses the support at R1 or at its current point, a decline will be there for it to reach lower amounts such as S2. The point is to wait for some confirmation candles in order to make sure what will happen next and act precisely.
Warning: This is just a suggestion and we do not guarantee profits. We advise you to analyze the chart before opening any positions.
Wish you luck

long DYDX$DYDX broke through the resistance level. Bullish trend is expected to continue and reach teh resistance at 2.07$

DYDX at resistance across multiple HTF and structureIf you ever were looking for confluence on a trade, here it is. This is the weekly. At the close, it pumped straight up to weekly tenkan that lines up with the macro resistance downtrend. If you filter through all other HTF, you will see the tenkan here as well. Great short opp.

#DYDXUSDT #LQRUSDT #TOBTC EMA200 important resistanceimportant resistance EMA200 DAILY and fibo level at price $2.12 and $2.175
Minor support $1.599
ststic support $1.48

#DYDXUSDT #LQRUSDT #TOBTC EMA200 important resistanceimportant resistance EMA200 DAILY and fibo level at price $2.12 and $2.175
Minor support $1.599
ststic support $1.48

DYDX/ USDT Idea✅ ✅ Risk warning, disclaimer: the above is a personal market judgment and analysis based on published information and historical chart data on The trading view,
And only some of these analyzes are my actual real trades.
I hope Traders consider I am Not responsible for your trades and investment decision.

DYDXUSDT getting compressed below MA200I believe there is another pomp potential for DYDX after being compressed around MA200 for a few days. What do you think?
